

One of the more curious nuggets to come from the NCAA’s release of the NET was its decision to ignore scoring margin in overtime games. Any use of ‘artificial intelligence’ would have revealed that overtime scoring margin is just as useful for evaluating team strength as regular season scoring margin.
The simplest way to demonstrate this is to look at all overtime games where the teams met again during the season. (The other meetings need not be after the overtime game but nonetheless will be referred to as rematches for simplicity.) The correlation between scoring margin in the overtime game and scoring margin in the rematch (adjusted for home court) is 0.16.
That number doesn’t mean much without something to compare it to. We can use the same method on games that were tied with five minutes left in regulation. This is a similar situation – a game where the final five minutes are completely responsible for the scoring margin. The correlation between the margin in those games and the rematches is 0.11.
The samples are pretty robust here. There are close to 1,000 games in each case. Though in fairness if we look at regulation games where the margin was 0-5 points with five minutes the correlation bumps up to about 0.15. At any rate, the five minutes of overtime have been as useful for predicting the other game between the same teams as the final five minutes of regulation when the game is close.
I have heard some arguments against using overtime data. The general idea is that overtime basketball is different from regulation. Mainly due to players fouling out or players being more fatigued than usual. But the impact of fouls does not start when a player gets his fifth. Many minutes are lost to players during regulation who haven’t yet fouled out. Starters with four fouls are often kept on the bench until there are 3-4 minutes remaining and nobody is suggesting we ignore scoring margin in those cases.
Perhaps one might find it unjust when a team almost wins a game in regulation, goes to overtime, and loses by some large amount. But those extra five minutes are free data. And especially in a season as short as college basketball’s, it’s highly valuable data because nearly every possession is critical.
Both teams are trying their absolute hardest for those five minutes. Which is something that can’t be said during regulation play, when coaches are subbing in bench players to save their stars for the potential big moments later in the game. And even when the stars are on the floor, they are strategically conserving energy when their team gets a comfortable lead. If you are going to judge a team based on scores, ignoring overtime performance is leaving out useful information.
This method is also useful for getting an idea of when garbage time begins. We’ve done the work for games with 5 minutes left that are tied. But what about when a team has a one-point lead or five-point lead or 20-point lead at that time? Is the correlation of remaining scoring margin to the next time the team’s play constant? The answer is: “Definitely not, pal. Garbage time is real.” As you can see when we plot the r values for each scoring margin with five minutes left.
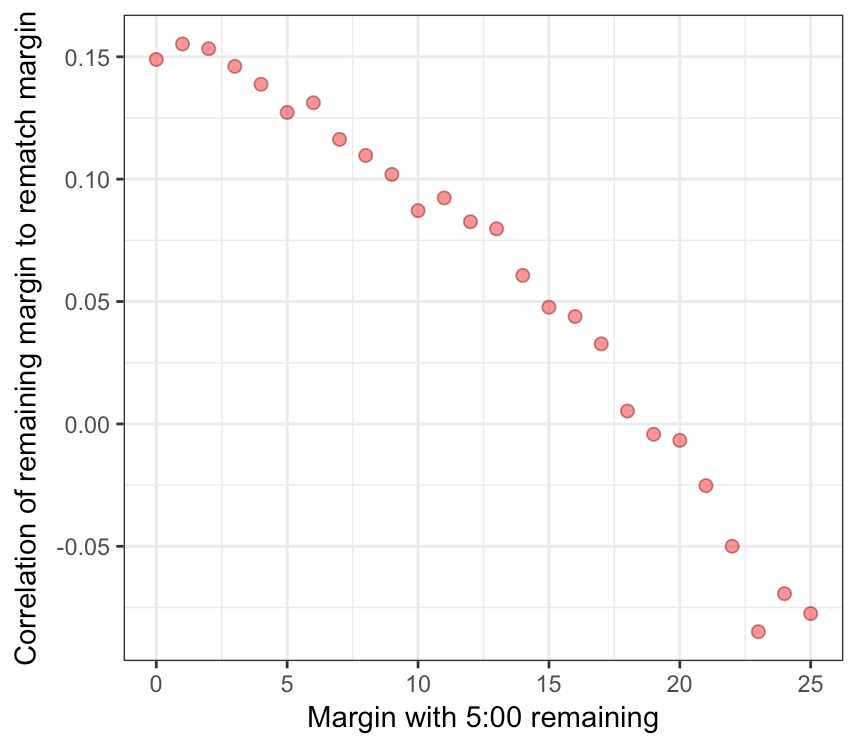
With five minutes left, the meaning of remaining scoring margin continues to decrease as scoring margin increases. By the time you get to 18 points the correlation is zero, meaning there is no relationship between remaining scoring margin and the margin in a subsequent game between the two teams. That essentially defines garbage time. I should point for the purposes of making a smooth graph, 18 actually includes all games with a margin between 18 and 23 points with five minutes left.
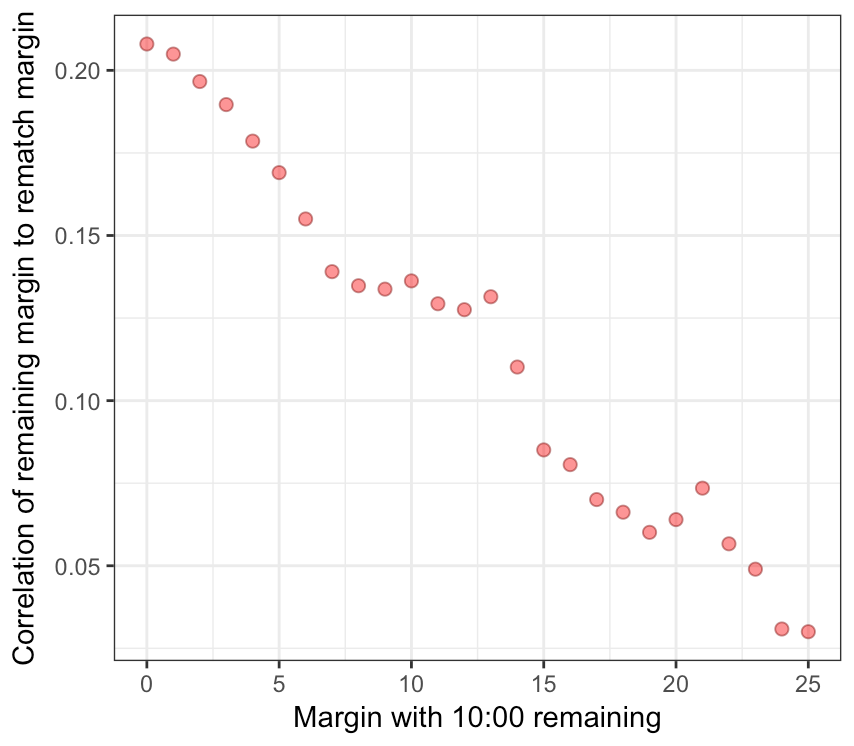
We can make these graphs for any time we want. The graph looks like this with ten minutes left:
And now with two minutes left:
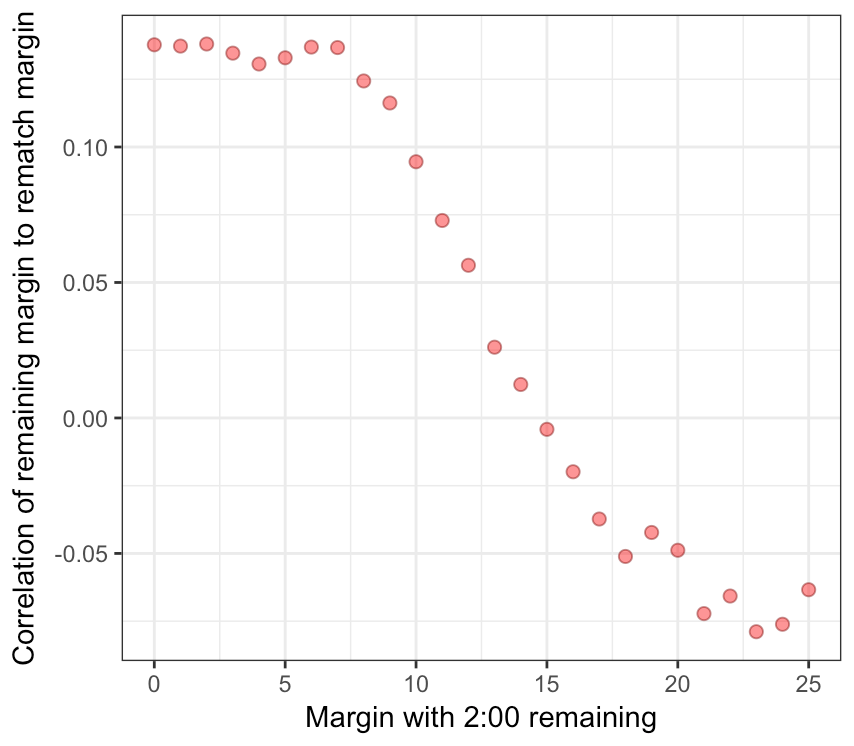
It’s kind of interesting that beyond 15 points, the correlation goes negative. Maybe the winning team is a little more eager to sub in the walk-ons or maybe there aren’t enough games to trust the values. But it wouldn’t be shocking that garbage time favors the weaker teams over the last few possessions of the game.
Finally, the values here are just averages over thousands of game. Determining the beginning of garbage time in a specific game is a theoretical concept that can never truly be known. But this approach at least gives one a rough idea of when garbage time begins. And in every case, the closer the game is, the more reliable the remaining data is. This applies to overtime just as much as it does in regulation.