

This is part of a series of posts examining whether offense or defense has more control of various aspects of a typical college basketball game. The introduction is here. A description of the methodology is here.
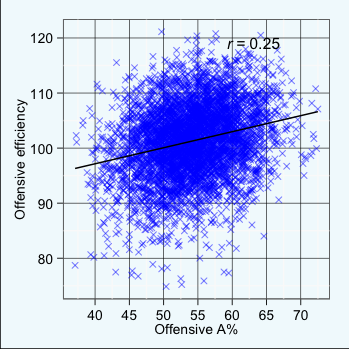
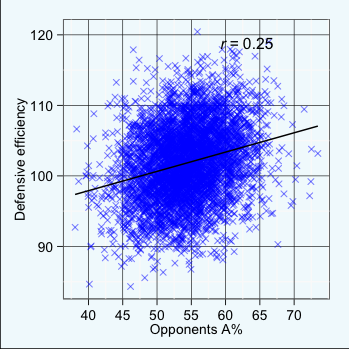
We always hear about how it’s desirable for the offense to share the ball. Although there are coaches like Andy Kennedy that can consistently put an effective offense on the floor that frequently scores off the dribble, assist rate is positively correlated with offensive efficiency. But while assist offense gets all of the attention, assist defense is real, too. And if you want a good defense, it helps to make the opponent score off the dribble.
Obviously, there are limits to this concept. You don’t need to worship at the altar of analytics to understand that if you give up straight line drives to the rim, your defense is going to suck. Even if those drives to the rim are on some sort of curved path, your defense is still going to suck. And if you’re forcing opponents to take long catch-and-shoot 2’s, your defense is going to succeed. But I’m speaking in generalities here, and I have graphs of data from the past 14 seasons of college hoops to prove that assistin’ is generally good for the offense and bad for the defense.
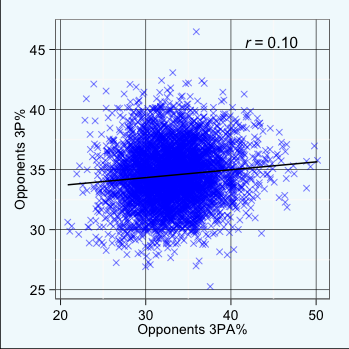
One of the least used measures on defense is assist rate allowed, and it’s time it got some publicity. Defense has 29% influence on assist rate, a figure that beats out its influence on 3-point percentage and in line with its influence on shot distribution. That makes sense given that defenses can influence how many 3’s their opponents take and assists are much more likely on made 3-point shots than made 2-pointers. And indeed there’s a strong relationship between a team’s defensive assist rate and the number of 3-point attempts allowed. An interesting aspect of defensive assist rate is that it has a stronger relationship to opposing 3-point percentage than 3-point rate does.
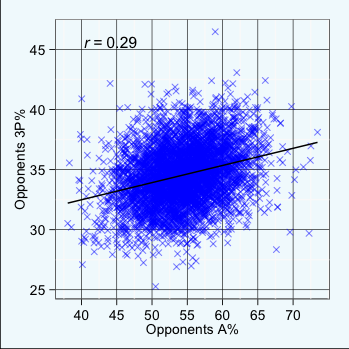
(I’d like to take a 30 to direct your attention to the topmost X on these plots. That’s the 2007 University of Utah team. Opponents made 46.5 percent of their 3’s against the Utes that season. That’s 4.87 standard deviations above the mean for 2002-2015 and 3.4 percent above the next worst figure. It’s also better than any single team has shot over a full season since 2002.)
Keep in mind I’m using overall assist rate here, so teasing out 3-point assist rate would figure to lead to a better fit to opponents’ 3-point percentage. Nonetheless, defensive assist rate appears to be a better proxy for how much pressure a defense puts on opposing shooters than defensive three-point rate. In fact, once you control for assist rate, teams that give up more three-pointers tend to have a better 3-point percentage defense. Here are the results of a simple regression to predict a team’s defensive 3-point percentage from its defensive assist percentage and 3-point attempt percentage.
Coefficients:
             Estimate Std. Error t value Pr(>|t|)
(Intercept) 27.162044   0.396132  68.568  < 2e-16 ***
OppARate     0.156314   0.008044  19.433  < 2e-16 ***
Opp3PAPct   -0.033820   0.010122  -3.341  0.00084 ***
Imagine a team that allows few assists and a lot of 3-point attempts. Opponents will be taking a lot of 3’s off the dribble and voila, there’s your 3-point defense. So perhaps 3-point defense is not about preventing 3-point shots, but preventing catch-and-shoot 3’s.
There’s a disconnect for zone teams in this case, which Wayne Tinkle illustrated at Oregon State last season and Syracuse demonstrates on an annual basis. An effective zone can give up a lot of assists and 3-point attempts, but consistently allow a low 3-point percentage.
While we’re on the topic of zone defense, I’d like to recognize the insanity of John Chaney. I only have stats for the last five seasons of his career which were his worst five seasons at Temple, but I suspect stylistically, the earlier part of his time with the Owls wasn’t too different. Chaney’s ascendance came before advanced stats became cool, but he always got a lot of credit for his defense. In retrospect it appears the praise may have been misplaced.
His zones allowed an absurd amount of 3-point shots. In his final season, opponents took 766 3’s and 761 2’s, the only team since 2002 to have allowed more 3’s than 2’s over a full season. And given that 3-point rates across college hoops were significantly lower in the ‘80s and ‘90s, it’s likely that the 2006 Temple team is the only D-I squad to ever accomplish that. Likewise, a Chaney team also owns the highest assist rate allowed. The 2003 Temple team saw opposing teams assist on 73.5 percent of their made field goals. Actually, Chaney owns the second and third-highest defensive assist rates as well.
Giving up a bunch of assists and three-point attempts doesn’t completely preclude a defense from being great, but few successful defenses operate this way. And by the end of Chaney’s career, Temple’s defense was ordinary by Atlantic 10 standards. I suspect even earlier in his career his defense got more credit than it deserved due to the slow pace of his offense that consistently had a miniscule turnover rate and that zone defense that forced long possessions as well. Maybe if Dean Oliver had previewed the 1989 college basketball season instead of the NBA, we would have all known this.
Here are the ten best and worst coaches in opposing assist rate, with a minimum of ten seasons in the business since 2002:
 1 Randy Bennett   45.3
 2 Mike Krzyzewski 46.4
 3 Bo Ryan         46.4
 4 Joe Scott       47.1
 5 Johnny Jones    47.6
 6 John Brady      47.8
 7 Scott Sutton    48.0
 8 Rick Stansbury  48.7
 9 Bill Herrion    48.7
10 Rob Jeter       48.8

 1 Jim Boeheim     63.1
 2 Robbie Laing    62.0
 3 Bill Carmody    61.9
 4 Jeff Neubauer   60.9
 5 Karl Hobbs      60.6
 6 Ed DeChellis    60.4
 7 Dave Calloway   60.4
 8 Ron Hunter      60.2
 9 Pat Kennedy     60.1
10 Derek Waugh     60.1
Assist rate also brings with it a substantial home court effect. How much of this is due to scorekeeper bias or just playing better at home is left as an exercise for the reader.
Year  %Offense  HCA
2015     73     2.4%
2014     69     2.4
2013     68     2.5
2012     56     2.8
2011     69     2.7
2010     71     2.7
2009     73     2.5
2008     78     2.8
2007     74     2.8
2006     78     2.7
AVG      71     2.6%
To my growing list of stats below I’ve added the respective correlation coefficients if you tried to predict a stat using a team’s season-long offense and defense separately. This gives an indication of the control that each side has in absolute terms. While the offense has a greater share of influence on its own free-throw shooting than its possession length, in an absolute sense it has more influence on its possession length. Sure, the defense can’t do anything about a team’s free throw shooting, but even so, it’s still difficult to predict from game to game.
Illinois led the country in FT% last season but had six games where they shot below the national average. By contrast, BYU led the country in shortest possessions and didn’t have any games where their possessions were slower than average. (Or even close – the slowest game the Cougars played was at Loyola Marymount where they averaged 17.4 seconds per possession, a full second below the national average.)
If the offense plays at a fast pace or takes a lot of 3’s, we can have a lot of confidence that they’ll play fast and shoot a lot of 3’s in their next game. The same can’t be said for teams that have a high FT% or 3P%. Those stats are less consistent from game to game.
Offensive Spectrum – Ordered by pct of offensive “control”
FT%  98%  (HCA=0.5%,  r(off)=.19, r(def)=.04)
APL  86%  (HCA=-0.1s, r(off)=.55, r(def)=.23)
3P%  83%  (HCA=0.7%,  r(off)=.12, r(def)=.06)
OR%  73%  (HCA=1.1%,  r(off)=.23, r(def)=.08)
3PA% 71%  (HCA=0.0%,  r(off)=.52, r(def)=.33)
A%   71%  (HCA=2.6%,  r(off)=.32, r(def)=.21)
???  64%
???  59%
???  50%
???  49%
???  36%
???  30%
???  15%