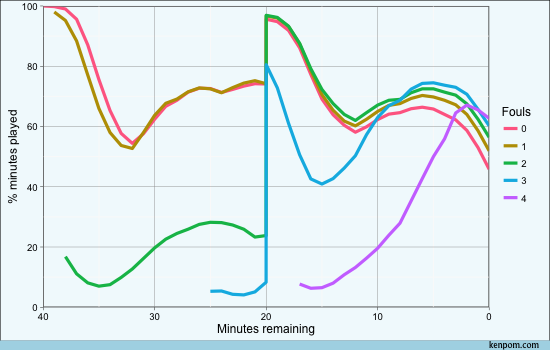
I’ve produced a few graphs in my day and it’s always comforting when the lines are smooth, like the plot of playing time vs. minutes left in the game:

The data (or at least the rate of change in it) is fairly stable from minute to minute. That’s not surprising considering there are seven seasons of data, or something like 38,000 games behind the plot. With 10 starters per game that gives us nearly 400,000 players worth of data.
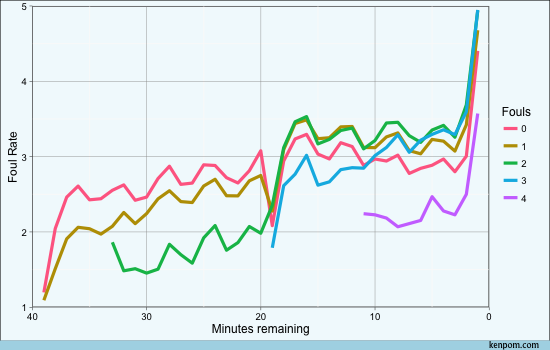
What struck me about the plot of foul rate vs. minutes remaining was that it was not so visually appealing. There are all sorts of bumps and changes in direction in the lines.

My initial reaction to seeing a chart like this is that there must be something wrong with my code. I still can’t rule out that possibility, but after looking at my work a while I feel reasonably confident the wiggles are real.
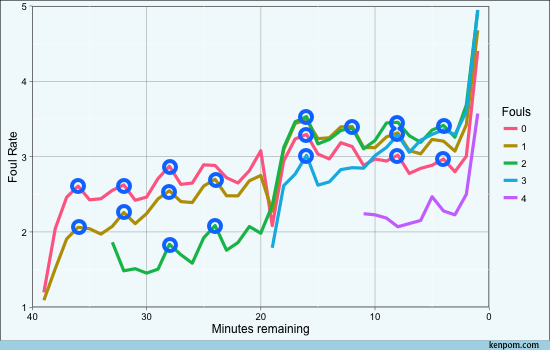
They also don’t appear to be completely random. Upon further inspection, the movements occur in four-minute cycles. Almost without exception, there are local peaks in foul rate at the 16, 12, eight, and four-minute marks of each half.1 For your convenience, I’ve highlighted those peaks here:

Since media timeouts tend to occur in the 15, 11, 7, and three-minute windows, I don’t think it’s a stretch to assume that media timeouts have some influence on foul rate. Immediately after these breaks, a player’s foul rate drops. It’s as if rested players are better at avoiding fouls. The relative lack of fouls at the beginning of each half might be players showing extra caution, but I suspect there is some contribution from players being particularly well-rested during those times, as well.
A player’s tendency to commit fouls is at least a function of five things: his own tendency to commit fouls, his opponent’s tendency to draw fouls, his foul count, time left in the game, and his fatigue level. All I have to prove the last factor exists is just this noisy graph, though. In reality, I’d feel better about relating on-court time of each player to his chances of picking up another foul. I’ll leave that as an exercise for the reader.2
On the other hand, it wouldn’t be a revelation if it were determined that fatigued players are more likely to pick up fouls. Tired players are going to be slower physically and mentally and therefore would figure to be more susceptible to fouls.
So maybe we didn’t learn anything that we didn’t already have a hunch about. But it’s interesting that the phenomenon appears to show up in the data this way. If you’re a coach willing to give the player in foul trouble some bonus minutes, sub them in after timeouts and don’t leave them when they are gasping for air.

