

This is part of a series of posts examining whether offense or defense has more control of various aspects of a typical college basketball game. The introduction is here. A description of the methodology is here.
Thad Matta’s teams do a lot of things well but the thing his teams have done best is not commit fouls. Three times in the past 14 seasons a Matta-coached team has produced the lowest defensive free throw rate in the land, and two other times he has finished second. All told, Matta’s teams have finished in the top ten a total of nine times since 2002.
It is much more difficult for someone to achieve this level of consistent excellence in terms of drawing fouls. Which makes some sense because you really shouldn’t be able to make somebody foul you. But that’s not to say that the offense can’t draw fouls: According to this work, the offense has 36% influence on free throw rate. And generally speaking, you can safely assume that a group of players that was good at drawing fouls one season will be good at drawing fouls in the next season.
The distinction here may be that one can teach any group of players how to avoid committing fouls while the ability to draw fouls is more personnel-dependent. Heath Schroyer owns two titles in offensive free throw rate, but last season—his first at Tennessee-Martin—his team ranked 310th. Marvin Menzies has four top ten finishes in his eight seasons at New Mexico State, but he also has three seasons outside the top 100.
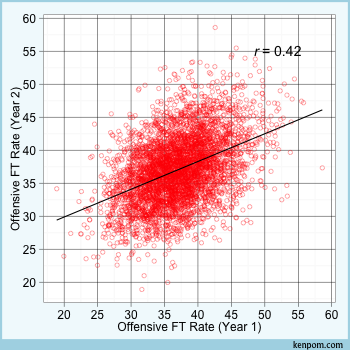
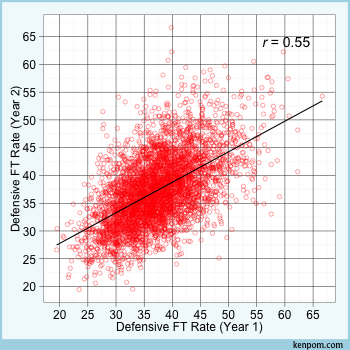
Another way to get a handle on the control issue is to look at year-to-year correlation among teams. Shown below are plots comparing a team’s performance in free throw rate in consecutive seasons for both offense and defense. Teams are slightly more likely to maintain a good (or bad) free throw rate on defense than on offense.
It’s time for the top ten lists. Here are the ten coaches that have had the lowest defensive free throw rate (minimum ten seasons since 2002).
 1 Thad Matta      25.8
 2 Jim Calhoun     26.4
 3 Mike Brey       26.9
 4 John Beilein    27.6
 5 Fran McCaffery  27.8
 6 Howie Dickenman 28.2
 7 Rick Stansbury  28.2
 8 Roy Williams    28.8
 9 Bo Ryan         29.0
10 Stew Morrill    29.2
Matta’s work was previously discussed, but Calhoun’s record is equally impressive. Is his last 11 seasons, just three were outside the top ten. And Brey has been in the top ten a total of seven times since 2002. Special credit to McCaffery and Williams whose fast-paced offensive systems prevent them from getting credit for a disciplined defense. Although I suppose discipline is in the eye of the beholder since a lack of fouls can also be indicative of defensive indifference as well.
Let’s look at the best coaches in terms of drawing fouls on the offensive side.
 1 Steve Shields   43.3
 2 Sean Miller     43.3
 3 Larry Eustachy  42.8
 4 Steve Hawkins   42.8
 5 Mark Few        42.5
 6 Mark Turgeon    42.1
 7 Steve Alford    41.6
 8 John Calipari   41.6
 9 Dave Loos       41.5
10 Dale Layer      41.5
This is a weird mix of successful high-profiile coaches and names you may not recognize. (If you’re looking for Joe Scott, he’d be on the top ten list of highest defensive free throw rate.) Get to know Steve Shields, the longtime head coach at Arkansas-Little Rock. He’s the clubhouse leader in offensive free throw rate, but unlike the leader on the defensive side, he has just two top ten finishes and his last two teams have finished 139th and 199th in that category. And Miller ranks a very close second with only four top 20 finishes. It’s just more difficult to consistently draw fouls than it is to not commit them.
The home team can expect to get about three more free throws per 100 field goal attempts than it would get on a neutral floor. How much of this is officiating bias and how much of it is the home team being better at home is left to one’s imagination.
Year  %Offense  HCA
2015     35     2.8
2014     40     2.9
2013     41     2.6
2012     39     2.9
2011     34     2.8
2010     38     2.7
2009     37     2.8
2008     37     2.9
2007     39     3.0
2006     26     2.7
AVG      36     2.8
Offensive Spectrum – Ordered by pct of offensive “control”
FT%  98%  (HCA=+0.5%, r(off)=.19, r(def)=.04)
APL  86%  (HCA=-0.1s, r(off)=.55, r(def)=.23)
3P%  83%  (HCA=+0.7%, r(off)=.12, r(def)=.06)
OR%  73%  (HCA=+1.1%, r(off)=.23, r(def)=.08)
3PA% 71%  (HCA=0.0%,  r(off)=.52, r(def)=.33)
A%   71%  (HCA=+2.6%, r(off)=.32, r(def)=.21)
PPP  64%  (HCA=+3.7,  r(off)=.51, r(def)=.36)
NST% 59%  (HCA=-0.4%, r(off)=.24, r(def)=.20)
2P%  50%  (HCA=+1.4%, r(off)=.26, r(def)=.25)
TO%  49%  (HCA=-0.7%, r(off)=.31, r(def)=.30)
FTR  36%  (HCA=+2.8,  r(off)=.20, r(def)=.27)
???  30%
???  15%