

This is part of a series of posts examining whether offense or defense has more control of various aspects of a typical college basketball game. The introduction is here. A description of the methodology is here.
The thing the offense has the least control over is whether its 2-point shot is blocked. The offense has just 15% influence on its block percentage in a game. Furthermore, blocked shots are the thing that the defense has the most absolute control over. In other words, offense plus random variance is lower for block percentage than any other stat in this study.
One discovery here is that the home court advantage for blocked shots appears to be huge. There’s a 1.2% boost for the home team. On the surface an extra block every 100 2-point attempts doesn’t seem like that big of a deal. But only 9.6% of shots are blocked in general, so in a relative sense the home team is getting 12.5% more blocks than it would if it were on a neutral court. And 25% more blocks than if it were on the road.
Year  %Offense  HCA
2015     14     1.2%
2014     14     1.2
2013     14     1.2
2012     15     1.2
2011     14     1.1
2010     19     1.2
2009     20     1.1
2008     14     1.2
2007     14     1.2
2006     10     1.1
AVG      15     1.2%
It is really difficult to separate the mental/physical boost of playing at home and the scorekeeping boost that a sympathetic scorer is providing. But regardless, the advantage for home blockers is greater than the advantage in the other notable judgment stat, assists. And far greater than steals which has similar overall frequency.
The raw data confirms this phenomenon as well. In conference games since 2002, the home team has recorded 144,882 blocks and the visiting team has had 117,544 blocks for a difference of 23.3%. There’s surely some scorekeeper bias here, but it’s also possible that blocks are very sensitive to natural home court advantage and that scorekeepers are playing an insignificant role.
Take a look at the teams that have enjoyed the largest home court advantage in blocks. Here’s the top five, just looking at conference games since 2002.
1 Denver       75.1
2 Utah Valley  65.8
3 Rutgers      64.6
4 C. Arkansas  64.0
5 The Citadel  61.6
Denver has had a whopping 75% more blocks recorded at home than on the road. While it’s tempting to say there’s something sinister going on here, this may not be a case like the conscious assist bias at Sam Houston State, which is the only place where any successful pass preceding a made basket is considered an assist. Both Denver and Utah Valley experience an unusually large home-court advantage in general, probably owing to a combination of altitude and opponents’ travel distance. It also seems to be an unlikely coincidence than in the NBA, that at least for one season, Denver’s professional team was shown to have the largest block bias.
However, the fact that I’m referencing a 2009 study on a message board should tell you that there’s been little research into this matter. If one searches the internets for assist bias, you’ll find a handful of studies and mainstream articles. But a similar search for blocked shot bias returns nothing fruitful. And while the leaders in home-court blocked shot bias track well with overall home-court advantage, it’s not true for every team. Hawaii, consistently among the the kings of home-court advantage, have had nearly identical home and road block percentages since 2002.
This made me wonder if there’s a way to tease out scorekeeper bias from a true home-court boost. I tried and tried and didn’t really succeed in this area, but I still have some useful scatterplots to share. What I did here was split each team’s conference games since 2002 into two sets – before and after February 1 of any season. For instance, here’s a comparison of a team’s home assist bias in the two halves.
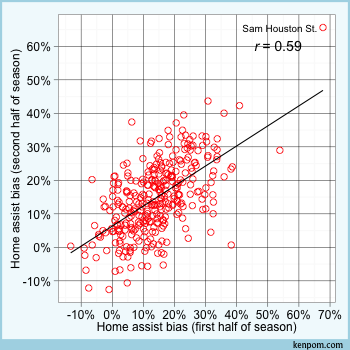
Sam Houston State is in its own galaxy, but even without them, there’s a pretty strong relationship between home assist bias in our two samples. This itself is not a smoking gun for scorekeeper bias. I suppose one could claim that there is some aspect of each home floor that may affect the amount of assists a team gets, but now you’re competing with 9-11 truthers for believability.
Here’s the same plot for blocked shots.
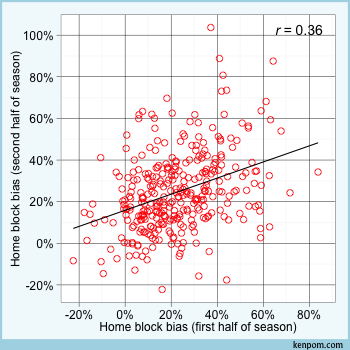
There’s a nice relationship here, too. Keep in mind there are many more assists than blocks, so there’s more noise associated with the blocks plot. It’s possible the scorekeeper bias is just as strong with blocks as it is with assists. The only way I can figure to determine that is to do a Monte Carlo simulation assuming various degrees of scorekeeper bias and see how the results compare to the real world. Perhaps for a future summer series.
However, I do think it’s more plausible that at venues where the home-court advantage is greatest, there actually may be more blocked shots by the home team. To test that I compared blocks in one half with home-court efficiency margin advantage in the other half. (Home-court efficiency margin advantage is the difference between home and road efficiency margin in a season, using conference games only.)
The plot is not shown here because there really wasn’t a relationship. So maybe it’s pure coincidence that Denver and Utah Valley enjoy the largest home court advantage and the largest blocked shot bias.
The effort wasn’t completely wasted. There are some other cool things to look at. Here’s the relationship between home advantage in efficiency margin in the two samples.
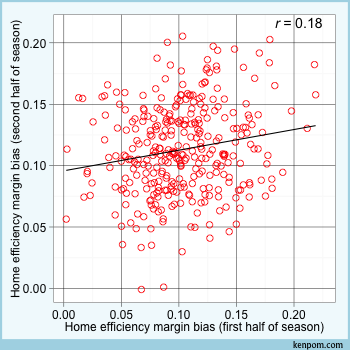
Well, this relationship isn’t as strong as the block relationship, and the scorekeeper can’t fudge the point total, so maybe it is more about the scorekeeper with respect to blocks. Shame on you, Denver!
Like blocks, most stats don’t predict out-of-sample home efficiency margin well. But there’s one stat that actually does better than efficiency margin itself. Take a look:
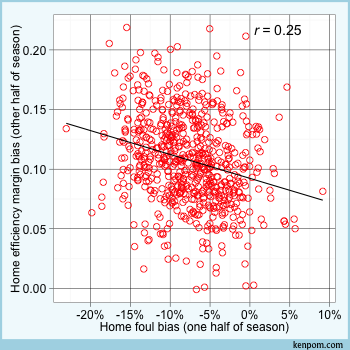
If you want to predict future home-court advantage going forward, the best box score stat to use is home foul bias. You can even do a little better using a combination of home foul bias and home non-steal turnover bias, which includes some fouls and other judgment calls as well. The error in such a forecast is still rather large. We have 14 years of data for most of these teams, but we could use about 50 years more.
To be more clear, fouls and non-steal turnover bias predict variation in home-court advantage among teams. The bulk of home-court advantage in college basketball can be explained by the small advantages we’ve seen in each stat examined in this series. But the difference in home-court advantage between Wisconsin and Howard can be predicted by the difference in fouls and non-steals that each team experiences home and away. However, there’s still the issue of the effect of elevation and travel on home court advantage. Just using fouls and non-steal advantage to estimate home-court advantage systematically underestimates the advantage that high-elevation and geographically isolated teams (basically, Hawaii) have had.
On that note, let’s call a wrap to this series. As a reminder, I’ll be posting a summary of the O vs. D series before the season begins, so if you didn’t read all 13 posts or just weren’t interested enough to dive into the details, I’ll have some key points for quick reference.
Below is the final list of the stats examined in this series, in descending order of offensive control.
Offensive Spectrum – Ordered by pct of offensive “control”
FT%  98%  (HCA=+0.5%, r(off)=.19, r(def)=.04)
APL  86%  (HCA=-0.1s, r(off)=.55, r(def)=.23)
3P%  83%  (HCA=+0.7%, r(off)=.12, r(def)=.06)
OR%  73%  (HCA=+1.1%, r(off)=.23, r(def)=.08)
3PA% 71%  (HCA=0.0%,  r(off)=.52, r(def)=.33)
A%   71%  (HCA=+2.6%, r(off)=.32, r(def)=.21)
PPP  64%  (HCA=+3.7,  r(off)=.51, r(def)=.36)
NST% 59%  (HCA=-0.4%, r(off)=.24, r(def)=.20)
2P%  50%  (HCA=+1.4%, r(off)=.26, r(def)=.25)
TO%  49%  (HCA=-0.7%, r(off)=.31, r(def)=.30)
FTR  36%  (HCA=+2.8,  r(off)=.20, r(def)=.27)
Stl% 30%  (HCA=+0.4%, r(off)=.21, r(def)=.32)
Blk% 15%  (HCA=+1.2%, r(off)=.16, r(def)=.40)