

Here’s a histogram of the home team’s scoring margin in all conference games over the past ten seasons.
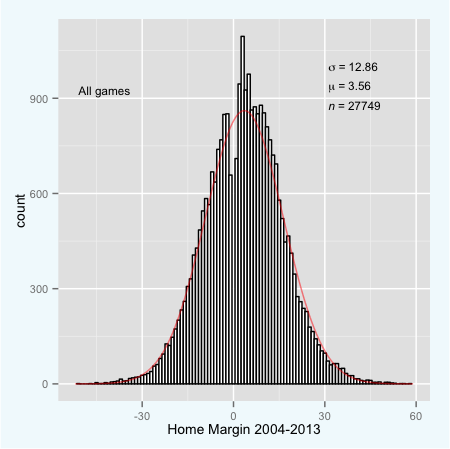
For the most part it has the look of a normal distribution. But it’s not exactly normal. Most noticeably, there’s the lack of data at the values of 1, 0, and -1. There are many fewer one-point games than Carl Friedrich Gauss would expect (as indicated by the red line depicting the normal distribution), and there are no zero-point games. I have a theory on the lack of zero-point games, and it goes like this: There are no ties in basketball. I think that’s airtight. The lack of one-point games is slightly less-obvious, but it too is an artifact of how the game is played. There are fewer one-point games than two-point games (or three, four, five and seven-point games, for that matter).
We can solve the problem of the missing zero-point games by looking at scoring margin at the end of regulation.
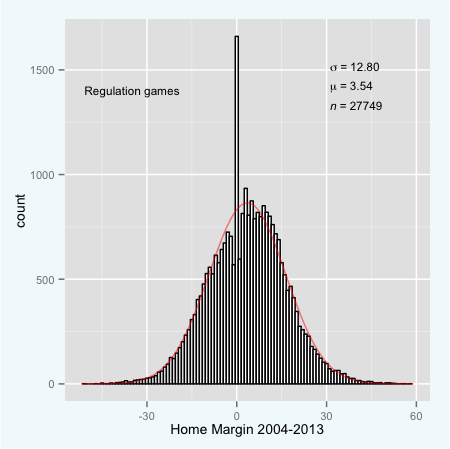
C.F. Gauss is rolling over in his grave. Zero-point games happen a lot, at least relative to other close games. It makes some sense that zero is a popular number. If you have the ball with 30 seconds to go and the game is tied, you’ll hold for the very last shot, which if unsuccessful will result in overtime. Whereas if you trail by a small amount, you won’t take the very last shot and if you lead by a small amount, you’ll get fouled. A tie score late in the game has a high chance of going to overtime, while being up by three late in the game has a much lower probability of ending in a three-point win. There’s a lot more stuff that goes on late in a game that’s not tied.
It’s also possible that coaches are a little too willing to settle for overtime. I’m not the only one that has wondered why there aren’t occasions where the defensive team fouls in a situation where the game is tied and the shot clock is off. I mean, by not fouling your options are getting beat on a last-second shot or going to overtime where your chances of winning are around 50 percent. There certainly have to be cases where fouling improves your chance of winning. It would be interesting to see a similar plot of data from Euroleague games, where apparently the practice of fouling in a tied game is common.
The tie-game scenario also helps to explain the relative scarcity of one-point outcomes. The offensive team is either going to miss which lead to overtime, or they will score and the game will end. And in those cases, the possibility of a one-point possession is very low. Likewise, last-possession scenarios where a team trails by two or three are not going to feature strategies where a team will get within one point.
There’s more interesting stuff here, too. Notice that there are many more 7-15 point wins for the home team than a normal distribution would suggest. These appear to come at the expense of 16-30 point wins for the home team. Are home teams more likely to coast at the end games than visitors? I have no evidence to support that, but there is something different about the home team’s behavior.
Finally, here’s a plot of scoring margin in single-overtime games over the past ten seasons…
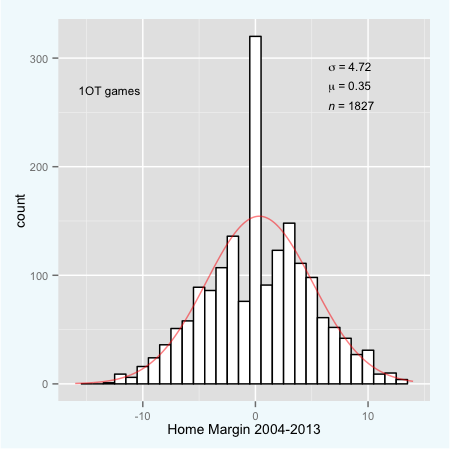
You still see the spike of tie games and the lack of one-point games, too. The other thing is that the home team wins by an average of .35 points. Now, that’s not the best way to compute home-court advantage, but it’s not a bad estimate either. It happens to be one-tenth of the value for regulation games. Overtime is one-eighth the length of regulation games. I wouldn’t sweat the difference in those two numbers. Perhaps home-court advantage is not as big of a deal at the end of close games as conventional wisdom would have us believe.
That concludes this episode of “Fun with Histograms”. Next time you observe a one-point game, appreciate its significance. It’s way more rare than an overtime game.