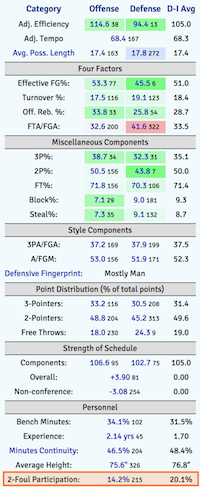
Who likes it when players get into foul trouble? Well, maybe nobody, but it’s one of the most interesting strategic aspects of college basketball. While people have been thinking about ways to eliminate the individual limit on personal fouls, I’d feel very strongly about preserving the five-foul limit if officiating were perfect.
Mainly because I don’t like fouls and of all the deterrents to fouling, the personal foul limit is the most important. One can look at how the foul rates of reserves change when they become starters to get an idea of that. Almost surely, any softening of the individual foul limit will result in more fouls being committed. Which leads to more free throws and a slower-paced, less-entertaining game.
Of course, officiating isn’t perfect and never will be, and it sucks when someone gets a foul they don’t deserve. And I’m sure coping with foul trouble is an annoying part of a coach’s job during a game. But it’s also necessary. As I discovered when looking at this issue in 2016, players are more conservative defensively when they get in foul trouble, so expecting coaches to ignore the situation is unrealistic if they are doing their jobs right.
Furthermore, there are reasons you’d rather have a player available for the end of a potentially close game than just simply playing him until he fouls out. On the flip side, a player whose effectiveness is reduced due to foul trouble might still be better than the alternatives and if that player isn’t particularly foul-prone to begin with, there’s little need to bench him. Naturally, each coach handles these decisions differently. (And because this issue doesn’t seem to be well-understood, I suspect many are using a sub-optimal approach.)
With that in mind, I’ve added something called ‘2-Foul Participation’ to the team scouting reports which gives us a blueprint for each coach’s philosophy. Often I find myself watching a game and a player picks up his second foul in the first half. Off to the bench he goes. But is he headed to the bench for good? What are the chances he sees the floor again before intermission? We can’t get inside the coaches head or see the future so there is no way of knowing for sure, but coaches have tendencies. However, unless you watch a lot of games involving the team in question and either have an amazing memory or take a bunch of notes, there is no reference for what a coach’s tendencies are. 
This is an effort to change that. 2-Foul Participation is simply the percentage of time that a starter with two fouls in the first half has been allowed to play. If a starter picks up a foul with ten minutes left in the first half and plays one of those remaining minutes, then he’s participated in 10% of the minutes he could have. Add up the possible minutes for all starters and the minutes on the floor and you get the team’s number for the whole season.
That figure was around 20% for all of big-time college basketball last season, a number that has been dropping steadily since 2010, the first season for which we have complete play-by-play data. Coaches are gradually getting more conservative about playing guys with foul trouble in the first half. Even with foul rates declining to historic lows last season, coaches were less willing to play a guy after he picked up his second foul. It makes one wonder if there is a level of fouling low enough to make coaches reconsider their philosophy.
Perhaps there is some strategic use for this information. I don’t know. If you know a coach will sit a player with two fouls for the rest of the first half, then to some extent that player is already in foul trouble with one foul. They are one foul away from fouling out in the first half! Maybe one can do something with that information or maybe not. This is one of many reasons why I am not a coach.
Mainly, though, this is for informational purposes. You no longer have to guess if a coach will let a player with two fouls play. In addition to the data being added to the team scouting reports, it’s also on the coaching resumes and on a leaderboard page of its own. Now we can be enlightened that Bryce Drew is willing to let his players play while Tony Bennett isn’t.
Why only look at cases of two fouls and not three or four fouls? Well, in an a stunning coincidence, coaches universally agree that starters with two fouls are no longer in trouble when the second half starts. That provides a neat limit on the time frame to examine. There is no similar agreement on when it’s safe to play someone with three or four fouls, requiring the need for a more complex, and thus less transparent, method to measuring foul trouble tendencies in those cases. Besides, I’d expect 2-Foul Participation goes pretty far in explaining how a coach handles those other situations.
As far as the accuracy of this information, the usual caveats apply when deriving stats from play-by-play data. Substitution data can occasionally be wonky, and about 10% of the time it is not possible to know who is on the floor. Nonetheless, given the distinct trends we see among coaches, the data is plenty good enough for our purposes.
There are a few other measures on the leaderboard page. There is the total amount of time starters have two fouls and the total time they are on the floor. This is mainly for bookkeeping purposes and to help you and I catch gross errors in the calculations. I also created an adjusted 2-foul participation measure. In practice, there is a tendency for coaches to give backcourt players more latitude with two fouls and also there are trends in time as well. (Peculiarly, the most likely time for a coach to play someone with two fouls is with 4-5 minutes left in the half.)
Adjusted 2-foul participation accounts for these trends but in reality there are very few coaches for whom this makes a significant difference. I’ve also shown bench minutes on the page. There’s an inverse correlation between the willingness to play guys in foul trouble and how much one trusts one’s bench. Although, the cause and effect aspects of this relationship certainly vary from team to team.
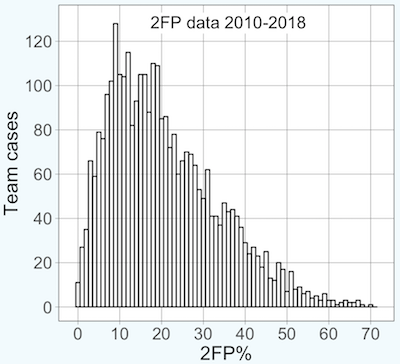
Finally, I’ve provided the distribution of 2FP for all 3,159 teams over the past nine seasons below. The distribution has a long right tail, which means that most teams are below average. For instance, the difference between the 10th and 40th ranked teams last season was the same as the difference between 226th and 351st. So while there’s certainly a fun trivial distinction to being last (congrats, John Beilein for earning the title last season), in reality there’s not much functional distinction between 300th and 351st in any given season.


