

There are a few ways to analyze something but using the wisdom of the crowd is one my favorites. Of course, it depends on the particular crowd. Me, I’d prefer to use the crowd that bets money on things. Anyone can make predictions but history shows the best ones are made by people that put something tangible on the line.
Unfortunately, the types of things I really care about, like who is the best team at any given moment, are not something such money-risking people will tell us directly. Mike Beouy helpfully publishes betting market rankings based on game point-spreads that tries to assess this. But even then, if I want to know the third-best team in the Patriot League according to the crowd, I am out of luck.
Still, there is much to be learned from point spread data. One simple thing to look at is home court advantage. It’s been a personal obsession of mine for a few years now. Over a decade-plus, I have written pieces on HCA ranging from horrible to poor to lame to finally, reasonably useful.1 The slog culminated in my ever-updating home-court ratings for every team in college basketball based on certain game statistics that have been shown to be predictive of future home-court advantage.
Coming up with some sort of regression equation to identify home-court advantage is neat for me but not the most transparent thing from the reader’s perspective. One can fairly easily dismiss the results if they conflict with their own thinking because Ken gave a lot of disclaimers and “regression” might be a code word for “guessing”. The words do sound the same and share a frightening number of letters.
But some skepticism is expected and the conscientious analyst should be poking holes in one’s work, anyway. In that spirit, I was curious to see what the market thought of home-court advantage on a team level. So using all of the point spreads I could get my hands on for the past five seasons, I looked at every case where two teams played in each other’s home venue during the regular season. I took the home-court advantage for each team to be half the difference in the point spread in those two games.
For example on January 8, 2014, Akron was favored by 6.32 points2 at Ball State. In the return game on January 29, the Zips were favored by 13.96. Take the difference of 7.64, cut it in half, and the 3.82 is the assumed home court advantage in the pair of games. (Overly precise, for sure.) That difference is mostly home-court advantage but there were 21 days between games. In that time the market might have taken a different view of one or both teams, or some degenerate with deep pockets could have developed a sudden interest in betting MAC games.
But get enough games for each team and a signal starts to emerge. In the era of unbalanced conference schedules there aren’t that many pairs of games in a given season, and some teams don’t have any games to use because their conferences aren’t worth the time of oddsmakers. But over the past five seasons there were 258 teams that have at least 15 pairs of games to use.
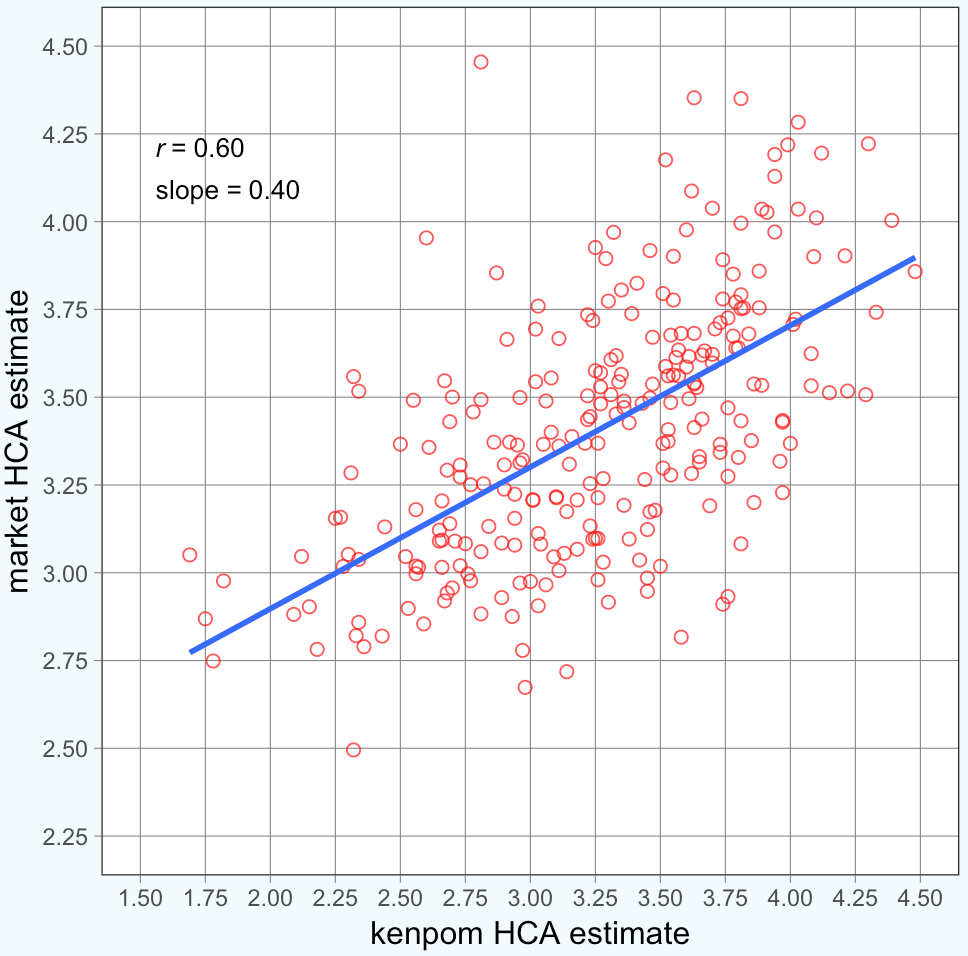
My main interest here is how these numbers compared to my statistical HCA estimates. The team with the largest spread-derived home-court advantage is Hawaii with a value of 4.5. In my system the Rainbow Warriors are ranked 238th with a value of 2.8. That’s not a good start! It turns out that’s the biggest outlier in the comparison, though. Good news for your guy: The market tends to give a larger home-court advantage to the teams that also have a large statistically-derived home court advantage. Here’s a comparison in scatterplot form:
All in all, I’m pretty happy with that. There is some noise for sure, but there will always be. Home court advantage is a moving target, but because there’s no way to precisely measure it, we need years of data using the methods shown here to get a reasonably stable number.
The noise goes both ways, too: There’s noise in my method and noise in the point spread. But given the general agreement in the two methods, there’s additional confidence that we can distinguish between good, average, and bad home courts. As the games threshold is raised to limit the teams included in the market-based method, the correlation between the two methods increases. A games threshold of 40 only leaves me with just 81 teams, but the correlation jumps to 0.72. This suggests that with more data, the two methods would produce converging estimates for each team.3
Circling back, the Hawaii discrepancy is interesting since there isn’t a travel component in my method. Obviously, a 6-hour plane trip should take a lot out of the traveling team. Boston College’s home court is rated poorly by both methods, but it would suddenly be a tough place to win in if they moved to the Pac-12.
It’s also interesting since over the past five seasons, Hawaii’s home/road difference in scoring margin in conference games has been a mere 4.13 points, suggesting a home-court advantage of around 2. The team has gone 25-15 at home while going 21-19 on the road. According to the market, Hawaii has been either underachieving at home or overachieving on the road for an extended period of time. And based on its performance against the spread, it is entirely the former.
As I said, I have a lot of confidence in the crowd, so I fully expect Hawaii does have a strong home court. But if we can’t see that in the results over a five-year period, it should give you some appreciation for (a) how difficult it is to measure home-court on a team level and (b) how little difference there is between the best and worst home-courts in the country.
Teams that run up a long home-court winning streak are doing it mostly because they are better than their opponents and they just happened to save their worst performances for either poor opponents at home or games on the road. Sure, the home court contributes to a long winning streak, too, but any special advantage a team has in their building is a very small factor.
One other interesting thing to look at is the season average for home-court. It’s been documented that home-site advantage is decreasing across different sports and leagues in recent years and college basketball is no different. The market has followed this trend, except for last season.
Season  HCA   Games
 2014   3.68   1626
 2015   3.46   1730
 2016   3.35   1858
 2017   3.23   1824
 2018   3.30   1668
The odd thing is that in real life, home-court advantage did make a resurgence last season, with conference winning percentage increasing to 61.0% for home teams after reaching a historic low of 59.0% in 2017. It’s an unexpected change especially if one believes fouls are an important player in home-court advantage, since fouls called per possession plummeted to a level not seen in at least two decades.
Next, let’s take a look at the average HCA by conference.
 rk Conf  HCA
  1 B12   4.0
  2 SEC   3.8
  3 B10   3.8
  4 MWC   3.7
  5 P12   3.7
  6 Sum   3.7
  7 BE    3.5
  8 BSky  3.5
  9 BW    3.4
 10 MVC   3.4
 11 ACC   3.4
 12 MAC   3.4
 13 SB    3.4
 14 A10   3.4
 15 Amer  3.3
 16 WCC   3.2
 17 CUSA  3.2
 18 CAA   3.2
 19 Horz  3.2
 20 SC    3.1
 21 MAAC  3.0
 22 OVC   2.9
 23 Ivy   2.9
And finally, the market-based home-court values for each team with at least 15 game pairs to use.
                                  H/A
 rk Team                   HCA   Pairs
  1 Hawaii                 4.5     26
  2 Denver                 4.4     37
  3 LSU                    4.4     24
  4 West Virginia          4.3     42
  5 Arkansas               4.2     23
  6 Missouri               4.2     25
  7 Iowa                   4.2     27
  8 Alabama                4.2     23
  9 Baylor                 4.2     43
 10 Oklahoma               4.1     45
 11 Washington             4.1     35
 12 BYU                    4.0     45
 13 New Mexico             4.0     37
 14 Kansas                 4.0     44
 15 Utah                   4.0     35
 16 Kansas St.             4.0     43
 17 Iowa St.               4.0     41
 18 Texas                  4.0     41
 19 Indiana                4.0     27
 20 Boise St.              4.0     38
 21 Old Dominion           4.0     20
 22 Nebraska Omaha         4.0     37
 23 Michigan               3.9     26
 24 Washington St.         3.9     34
 25 Texas Tech             3.9     43
 26 Fresno St.             3.9     37
 27 Oklahoma St.           3.9     44
 28 Arizona                3.9     34
 29 Texas A&M              3.9     24
 30 Utah St.               3.9     36
 31 Colorado               3.9     34
 32 Georgia St.            3.9     40
 33 Mississippi St.        3.9     24
 34 Montana St.            3.8     36
 35 Buffalo                3.8     33
 36 Ohio St.               3.8     26
 37 Georgia                3.8     25
 38 Marshall               3.8     21
 39 Penn St.               3.8     25
 40 North Carolina St.     3.8     20
 41 Purdue                 3.8     26
 42 Oral Roberts           3.8     30
 43 Nebraska               3.8     27
 44 South Carolina         3.8     24
 45 Maryland               3.8     23
 46 Air Force              3.7     38
 47 Florida St.            3.7     20
 48 Oregon St.             3.7     34
 49 Rutgers                3.7     28
 50 Wyoming                3.7     38
 51 Notre Dame             3.7     18
 52 San Diego St.          3.7     37
 53 Mississippi            3.7     25
 54 Oregon                 3.7     34
 55 Illinois               3.7     27
 56 Minnesota              3.7     27
 57 UNLV                   3.7     38
 58 Arizona St.            3.7     34
 59 Duke                   3.7     20
 60 Xavier                 3.7     44
 61 TCU                    3.7     44
 62 Sacramento St.         3.7     37
 63 Providence             3.7     44
 64 Massachusetts          3.6     22
 65 Tennessee              3.6     25
 66 Southern Utah          3.6     37
 67 South Dakota St.       3.6     37
 68 Colorado St.           3.6     37
 69 Arkansas St.           3.6     42
 70 SMU                    3.6     39
 71 Seton Hall             3.6     43
 72 Marquette              3.6     43
 73 Nevada                 3.6     38
 74 Montana                3.6     38
 75 Creighton              3.6     44
 76 Florida                3.6     24
 77 Eastern Michigan       3.6     35
 78 Davidson               3.6     24
 79 Louisville             3.6     23
 80 North Dakota St.       3.6     37
 81 Georgia Tech           3.6     19
 82 Georgetown             3.6     43
 83 Northern Arizona       3.6     37
 84 Cal St. Northridge     3.6     31
 85 Butler                 3.6     44
 86 Portland St.           3.5     37
 87 Ball St.               3.5     35
 88 Louisiana Lafayette    3.5     42
 89 Weber St.              3.5     36
 90 Memphis                3.5     38
 91 Michigan St.           3.5     27
 92 UCLA                   3.5     34
 93 Missouri St.           3.5     40
 94 Kentucky               3.5     24
 95 Valparaiso             3.5     41
 96 Indiana St.            3.5     41
 97 Wake Forest            3.5     20
 98 Portland               3.5     43
 99 Louisiana Tech         3.5     21
100 VCU                    3.5     22
101 Illinois St.           3.5     43
102 Toledo                 3.5     35
103 Loyola Chicago         3.5     42
104 Central Michigan       3.5     33
105 California             3.5     34
106 Cincinnati             3.5     39
107 Northwestern           3.5     27
108 South Dakota           3.5     36
109 Miami FL               3.5     19
110 Northern Colorado      3.5     35
111 Richmond               3.5     23
112 George Washington      3.5     22
113 Wisconsin              3.5     26
114 Georgia Southern       3.5     37
115 Auburn                 3.5     23
116 IUPUI                  3.5     39
117 UT Arlington           3.5     41
118 Vanderbilt             3.4     25
119 Western Kentucky       3.4     28
120 William & Mary         3.4     43
121 Bradley                3.4     41
122 Saint Louis            3.4     22
123 UC Davis               3.4     31
124 Charlotte              3.4     19
125 St. John's             3.4     44
126 Ohio                   3.4     35
127 Southern Illinois      3.4     41
128 Chattanooga            3.4     40
129 The Citadel            3.4     39
130 Stanford               3.4     34
131 UCF                    3.4     38
132 Duquesne               3.4     21
133 Pittsburgh             3.4     19
134 Eastern Washington     3.4     36
135 East Tennessee St.     3.4     34
136 Dayton                 3.4     24
137 UNC Wilmington         3.4     43
138 UC Riverside           3.4     32
139 Connecticut            3.4     39
140 Little Rock            3.4     39
141 Fort Wayne             3.4     36
142 Miami OH               3.4     34
143 Cal Poly               3.4     32
144 North Carolina         3.3     20
145 Idaho St.              3.3     36
146 La Salle               3.3     23
147 Gonzaga                3.3     42
148 Evansville             3.3     42
149 Akron                  3.3     35
150 East Carolina          3.3     29
151 North Dakota           3.3     36
152 Towson                 3.3     43
153 San Diego              3.3     45
154 Fordham                3.3     22
155 Pacific                3.3     44
156 Hofstra                3.3     42
157 Virginia               3.3     19
158 UNC Greensboro         3.3     40
159 Wichita St.            3.3     41
160 Cleveland St.          3.3     42
161 Kent St.               3.3     35
162 Saint Joseph's         3.3     23
163 USC                    3.3     34
164 South Florida          3.3     38
165 Troy                   3.3     41
166 Northern Kentucky      3.2     27
167 Drake                  3.2     43
168 Elon                   3.2     40
169 James Madison          3.2     42
170 Green Bay              3.2     41
171 Detroit                3.2     40
172 Villanova              3.2     44
173 Louisiana Monroe       3.2     41
174 Rice                   3.2     20
175 Western Illinois       3.2     36
176 Southern Miss          3.2     21
177 Houston                3.2     37
178 Northern Iowa          3.2     43
179 Northeastern           3.2     43
180 Western Michigan       3.2     33
181 Appalachian St.        3.2     38
182 Wright St.             3.2     42
183 Texas St.              3.2     41
184 Siena                  3.2     42
185 San Jose St.           3.2     36
186 UC Santa Barbara       3.1     31
187 College of Charleston  3.1     42
188 UTSA                   3.1     20
189 Eastern Illinois       3.1     27
190 Rhode Island           3.1     23
191 Pepperdine             3.1     44
192 Samford                3.1     38
193 North Texas            3.1     20
194 Temple                 3.1     38
195 Middle Tennessee       3.1     21
196 Bowling Green          3.1     34
197 George Mason           3.1     23
198 South Alabama          3.1     40
199 Oakland                3.1     42
200 Austin Peay            3.1     26
201 Boston College         3.1     18
202 Clemson                3.1     20
203 Northern Illinois      3.1     33
204 Wofford                3.1     40
205 Milwaukee              3.1     41
206 Morehead St.           3.1     26
207 Long Beach St.         3.1     31
208 Niagara                3.1     43
209 Canisius               3.1     45
210 Cal St. Fullerton      3.0     32
211 Brown                  3.0     35
212 Tennessee Tech         3.0     26
213 Iona                   3.0     41
214 St. Bonaventure        3.0     22
215 Furman                 3.0     39
216 DePaul                 3.0     45
217 Eastern Kentucky       3.0     26
218 UAB                    3.0     21
219 Marist                 3.0     44
220 Santa Clara            3.0     44
221 Quinnipiac             3.0     42
222 Tulane                 3.0     30
223 Harvard                3.0     35
224 Drexel                 3.0     43
225 Mercer                 3.0     35
226 Tennessee Martin       3.0     26
227 Saint Mary's           3.0     44
228 Dartmouth              3.0     35
229 Belmont                3.0     27
230 Idaho                  3.0     27
231 Youngstown St.         3.0     42
232 Illinois Chicago       3.0     42
233 Virginia Tech          2.9     19
234 Fairfield              2.9     44
235 Syracuse               2.9     20
236 Tennessee St.          2.9     26
237 FIU                    2.9     21
238 Western Carolina       2.9     38
239 UTEP                   2.9     21
240 VMI                    2.9     34
241 Monmouth               2.9     46
242 San Francisco          2.9     43
243 Manhattan              2.9     45
244 Rider                  2.9     45
245 Southeast Missouri St. 2.9     26
246 Yale                   2.9     34
247 Saint Peter's          2.9     47
248 Delaware               2.9     41
249 Loyola Marymount       2.8     44
250 Princeton              2.8     35
251 Tulsa                  2.8     31
252 Penn                   2.8     35
253 Columbia               2.8     35
254 Murray St.             2.8     26
255 Cornell                2.7     34
256 SIU Edwardsville       2.7     27
257 Jacksonville St.       2.7     27
258 Florida Atlantic       2.5     21
| ^1 | But even the last piece got rejected by three different outlets before I decided to post it on my blog. |
|---|---|
| ^2 | It’s 6.32 because I’ve averaged a bunch of different sports books. All data is taken from donbest.com. |
| ^3 | Further illustrating this point, on a conference-level, the correlation is 0.78. |