

In our last installment, we discussed the degree to which past home-scoring advantage predicts future home-scoring advantage. We can look at other stats and derive home advantages from them. For an example, let’s use home steals advantage. Like home-scoring advantage, this is the difference between a team’s home steal margin and road margin.
In conference games from 2002-2009, Alabama averaged 1.32 more steals than their opponents at home and averaged 1.98 fewer steals than their opponents on the road. That gives a home-steals advantage of 1.66, which led all teams during that time.
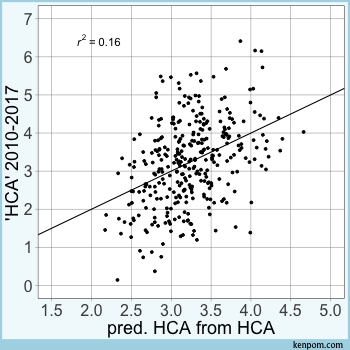
Does home-steals advantage predict future home-scoring advantage? Well, no, not at all. And most box-score stats don’t. But there is one stat that actually outperforms points. If we just use home-foul advantage by itself to predict future “home-court advantage”, it does significantly better than home-scoring advantage. Here are the predictions compared to the observed values based on using previous home-scoring advantage (HCA) and previous home-foul advantage (HFA).
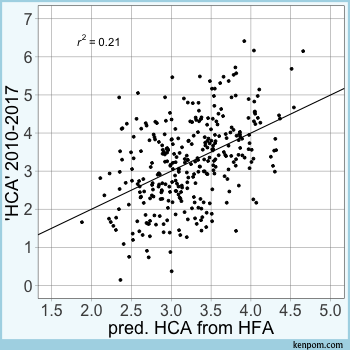
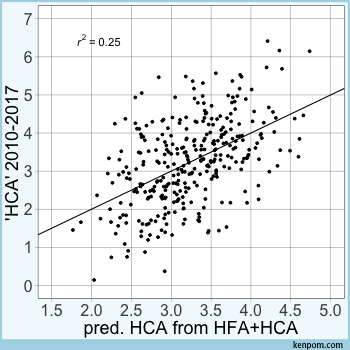
It’s not a huge difference, but our cloud of data points is getting stretched out along the line of perfect predictions a little bit. Of course, using both home-foul advantage and home-scoring advantage is even better to predict future home-court advantage. The plot on the right below illustrates the predictions of future home-scoring advantage made from such a model.
So it’s pretty clear that fouls drive home-court advantage more than any other thing recorded in the box score.1 Another piece of evidence that foul bias is an important source of home-court advantage is the identical trend in home-court advantage and home-foul advantage2 over the past decade-and-a-half.
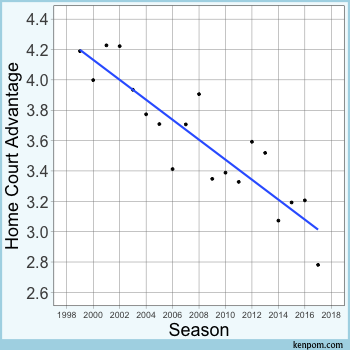
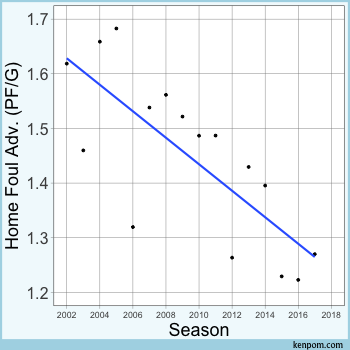
As far as what’s causing the decrease in home-foul advantage, one can only speculate. As officials and their supervisors get more and quicker access to video from games, it stands to reason that they would become more fair about making calls. But it’s also possible that less enthusiastic fan support may be decreasing the home crowd’s influence on officials.3 Or players themselves may be more prepared in road games than they used to be for some reason. Whatever the source, the result appears to be a fairer whistle towards the road team.
The next step is to make predictions for the home-court advantage of each team. So far, I’ve been using eight years of training data and eight years of target data. It obviously helps to have more seasons to stabilize some of the data, but just using half of our 16-year sample to predict the other half limits us to 325 data points.4 We could use the previous two years to predict the next season of home-court advantage. This has the drawback of increasing the error of predictions, but it has the benefit of increasing our sample by a factor of 15.
After considerable experimentation, I’m using the past six seasons of data for each team to predict its next two seasons of home-court advantage. This gives the value for each some stability while allowing flexibility for home-court numbers to change over time.
The increase in samples for the model revealed two other stats of importance: non-steal turnovers and blocks. Home advantages in both of those categories influence the model as well. And finally, a team’s elevation is included in the model.
I must warn you that any predictions of team-specific home-court advantage will be noisy. I mean, just look at the plot of predicted vs. actual HCA based on home-foul and home-scoring advantage. A lot of those points stray pretty far from the line of perfect predictions. And those are in-sample predictions. Any predictions for the next few years will undoubtedly be more noisy than that.
The result is that determining which team has the best home-court advantage is impossible with any degree of certainty. Even distinguishing between the tenth-best and 60th-best home-court advantage is on shaky ground. It’s probably best to think of of home-court rankings in groups of three. Teams rated in the top-third probably have an above-average home-court advantage and teams in bottom-third probably have a below average home-court advantage.
Nonetheless, I have posted a team’s home-court advantage computed from this method at the bottom of each team’s schedule. In light of the previous paragraph, the rankings and values are mostly for conversational fodder at your next cocktail party.
Along those lines, the team that currently owns the top ranking in home-court advantage is Air Force, at 4.5 points. An unlikely choice to be sure, and it’s worth repeating that we can never know which team has the best home-court advantage. It is probably not Air Force, a team that plays in a dingy 5,800 seat arena that requires clearing a security checkpoint to get to.
However, it’s illustrative of the fact that home-court advantage and team quality do not have to be related. The Falcons own the second-longest active losing streak in road conference games at 22. And over that time they’ve gone 13-10 in conference games at home. It’s a safe bet they benefit from an above-average home-court advantage.
| ^1 | This is largely consistent with findings offered by Tobias Moskowitz and Jon Wertheim in the book Scorecasting: The Hidden Influences Behind How Sports Are Played and Games Are Won. |
|---|---|
| ^2 | It’s important to note that a team’s home-foul advantage is not simply how many fewer fouls that team commits at home compared to its opponents. It’s the team’s foul difference at home relative to its foul difference on the road. |
| ^3 | There’s another question about what drives home-foul bias and given that teams from better conferences tend to benefit from home-foul advantage the most, one could infer that the crowd has a significant influence on this. |
| ^4 | Additionally, a team’s home-court advantage is probably not constant over an eight-year period. |