

There is often heated debate in basketball circles whether the basketball gods exist. Such a discussion seems absurd, like whether the Big Foot, Nessie, or Chessie is real. People have claimed to see those creatures, but nobody has ever gotten a picture or any other convincing evidence they exist.
Nobody has ever produced compelling evidence of the existence of the basketball gods, either. But you, dear reader, are about to see it.
Like the people who tell you they have seen Chessie, you are right to be dismissive. Like, come on, Ken, let’s have some real talk about stuff like which two teams have gone the longest without losing on the same day.
Sorry, not today. I have found the strongest proof yet that the basketball gods exists and determine the outcome in a lot more games than previously thought.
* * *
According to Wikipedia, halftime for spectators “offers the opportunity to visit the toilet, get some food or drink, or just exercise cramped limbs, without the fear of missing any of the action.” Well, what about reviewing the box score? You can’t believe everything on Wikipedia.
If you’re at a game, you’ve noticed that once the buzzer sounds someone on the staff of each team makes a beeline to the scorer’s table to acquire a pile of halftime box scores to distribute to the coaching staff for review. If the coaches could look at just one thing in that box score, what should it be?
Of course, points are the most important thing in the box score. But then what? Let’s take a look at all of the cases of a game being tied at half in a regular-season conference game over the past ten seasons. That removes points as a consideration while also removing non-conference games, where the home team is often the better team.
That gives us 1,262 games. Now we can get to the fun of determining which box score stat has best predicted the eventual winner of these tied games. First things first, the most useful thing in predicting the winner of these games is this:
Winning percentage in games tied at halftime
| Win Pct. | |
|---|---|
| Home team | 57.8 |
| Road team | 42.2 |
This violates the spirit of my inquiry, but provides a useful baseline. Home court advantage is still pretty powerful for the second half. Given that home teams won 60.4% of all regular season conference games during this time, a draw in the first half doesn’t even get the road team halfway to 50%.
Now let’s get down to business. As an example, here’s the breakdown for the team that had more steals at halftime.
Games tied at halftime: Winning percentage by team with more 1H steals
| Win Pct. | Change | |
|---|---|---|
| Home team | 58.4 | +0.6 |
| Road team | 42.9 | +0.7 |
When the team with more steals in the first half is the home team, they win 58.4% of the time, which is 0.6% more than normal. There is a similar improvement for the road team when it has the steal advantage. It’s not nothing, but close to it.
Rather than bore you – a person whose time is clearly valuable – with the results for every single box score stat, let’s cut to the chase. I haven’t found a more useful one than this: 3-point percentage. The rise of the 3-point shot has changed the game in profound ways and maybe we should have expected that this would be the most important thing.
However, it’s the team with (insert record-scratching noise) the worst 3-point percentage in the first half that is more likely to win.
Games tied at halftime: Winning percentage by team with worse 1H 3P%
| Win Pct. | Change | |
|---|---|---|
| Home team | 61.3 | +3.5 |
| Road team | 46.6 | +3.7 |
You may not get excited about a 3.5% improvement in winning percentage but you probably aren’t real fun at parties either. We only have 20 minutes of data to work with here and somehow 3-point percentage – as variable as it is over the course of a 30+ game season – ends up being the most useful thing in the box score. You get a 7% boost in win probability relative to your opponent for shooting worse from 3.
As you run off to the toilet or stretch those limbs, you might wonder why doing something so poorly would be of such benefit. The answer is either the basketball gods or some other “rational”possibility. Let’s walk through those first.
First off, the game is tied, so any advantage in one category will be offset by disadvantages in other categories. Most of the teams that lose the 3P% battle win the 2P% battle. A-ha! We know 2P% stabilizes quicker than 3P% and so the 2P% advantage is really what we’re seeing here. There are no mysterious outside forces involved.
Well, yes and no. It’s true that the teams shooting worse from 3 in the first half shot better from 2, and as expected, that advantage continued into the second half of these games.
2P% by half
| 1H | 2H | |
|---|---|---|
| Worse 1H 3P% than opponent | 50.0 | 50.7 |
| Better 1H 3P% than opponent | 44.4 | 49.3 |
That’s all well and good, but the theory blows up because the winning percentage for teams that shot better from 2 in the first half isn’t as good as the teams that shot worse from 3. The disadvantage in 3P% is driving the bus.
Games tied at halftime: Winning percentage by team with better 1H 2P%
| Win Pct. | Change | |
|---|---|---|
| Home team | 58.4 | +0.6 |
| Road team | 43.5 | +1.2 |
The 2-point advantaged team is only winning games about 1% more than usual while the 3-point disadvantaged teams are getting about a 3.5% bump. Maybe we can get some clarity by looking at the basic shooting stats by half for these cases.
| 3P% | 2P% | 3PA% | ||||
|---|---|---|---|---|---|---|
| 1H | 2H | 1H | 2H | 1H | 2H | |
| Worse 1H 3P% than opponent | 27.5 | 34.3 | 49.9 | 50.7 | 34.1 | 33.5 |
| Better 1H 3P% than opponent | 41.2 | 33.4 | 44.4 | 49.2 | 36.2 | 34.2 |
Not only do the worse 3-point shooting teams have a second-half advantage in 2P% but they also have an advantage in 3P%. The season-long 3P% for each group of teams isn’t significantly different so this is…unexpected.
I limited the study to tied games so scoring margin wouldn’t be an issue, but when we look at every first-half scoring margin, the pattern holds with remarkable consistency. (Forgive me for combining home and road games going forward.)
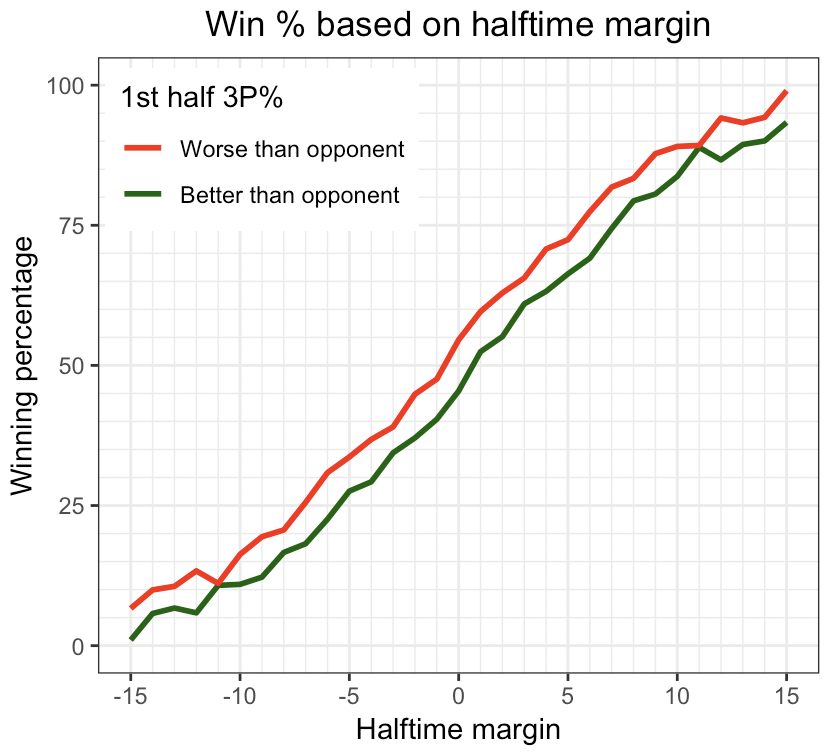
At every single integer value from 0 to 15, the team that shot worse than its opponent on 3-pointers has had a better winning percentage than if the team that had the 3P% advantage. For the most part, that difference is in the 6-7% range in terms of win probability. And we’re not even considering the shooting ability of each team.
But let’s do that. I’ve invented a stat called Surplus 3’s – the difference between a team’s made 3-pointers and what you would expect based on its season-long 3-point percentage (excluding the game being analyzed). The formula for Surplus 3’s looks like this:
Surplus 3’s = 3PM-3PA*(season 3P%)
If we look at which team had the advantage in surplus 3’s in the first half, there is a bigger disparity.
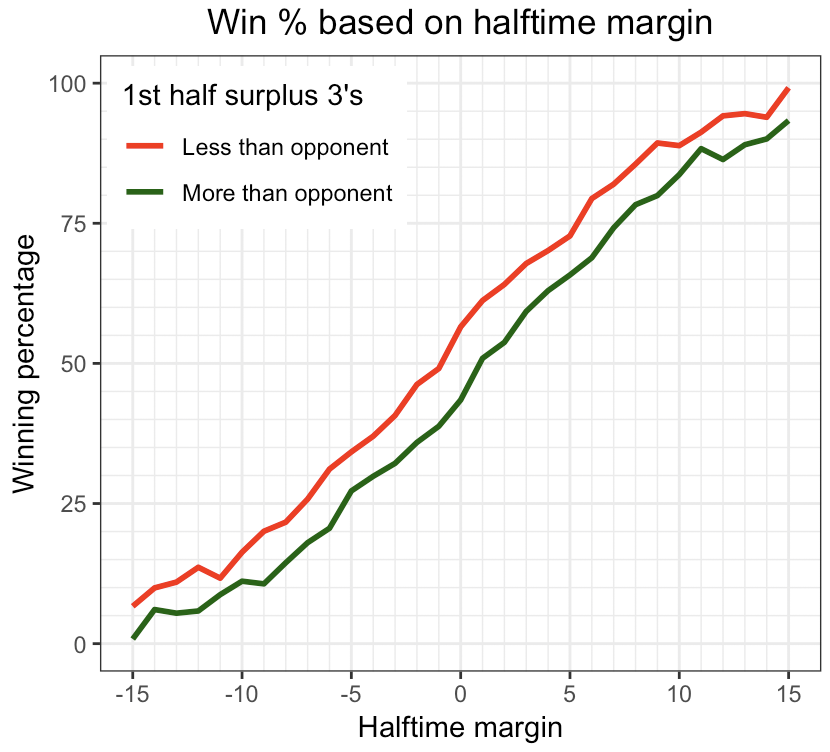 Now we’re talking about a 8-9% advantage. But we’re not done yet because the previous plot includes all cases where a team had even the tiniest advantage in surplus 3’s, even if it was just by .01. As you might imagine, as the gap increases, so does the potential advantage in win probability. Here’s what the plot looks like when a team has at least one more (or less) surplus 3-pointer than its opponent.
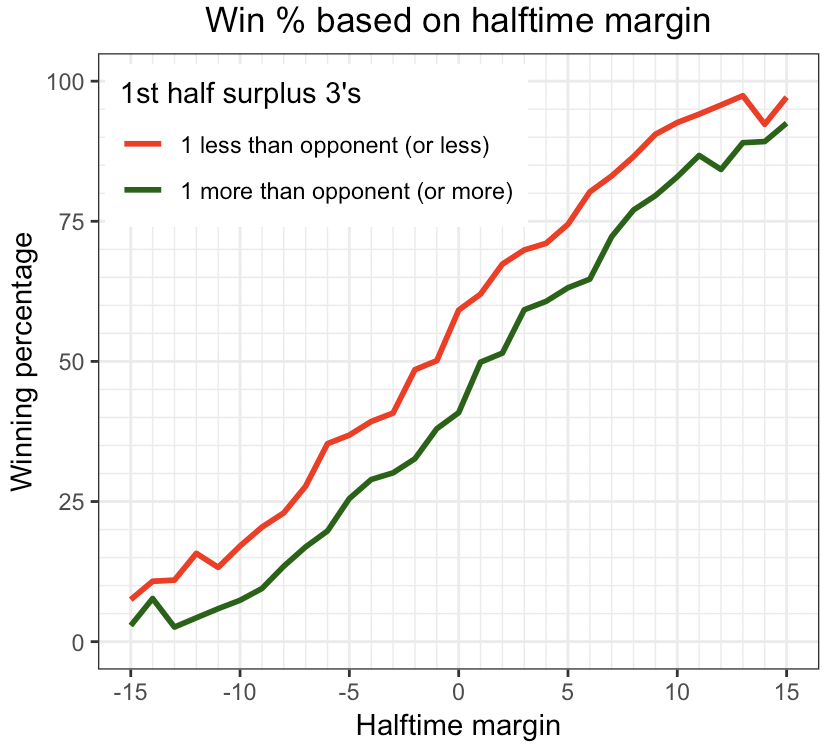
The advantage gets boosted to about 12% for these cases. Think about it this way: A three-point halftime lead built on better-than-expected 3-point shooting is about as valuable as a zero-point lead with worse-that-expected 3-point shooting.
Missed 3’s are worth zero on the scoreboard but they are an investment with the basketball gods. Of course actual points are better than dividends from the gods, especially with the tax implications for capital gains these days. Like, you should definitely try to make all of your shots. Hitting a high percentage of your 3’s will likely give you a nice halftime lead.
But if your team is making all of its shots and not separating from its opponent, the basketball gods will take notice and seek retribution in the second half. Likewise, if your team is hanging in there despite missing its 3’s, don’t despair. The gods are watching.