

Being bored with the foul-up-3 debate a few years back, I did an exhaustive analysis on the benefits of fouling when tied late in the game. And others have wondered if there are some advantages to fouling when leading by one or two late in the game. Occasionally, you see a team accidentally try one of these strategies when a player forgets the score. But for the most part, anyone entertaining the viability of these approaches must do so in a theoretical way.
That is, until last season when San Francisco’s coaching staff, led by head coach Todd Golden and director of operations Jonathan Safir, decided to embrace the power of math to squeeze out advantages when time and score dictated. It started when the Dons’ decided to not concede the final possession of the first half to Pacific in a game on January 11. While outside the scope of this piece, the math on this is pretty basic and more teams should do it.
It continued two weeks later when they decided to foul up 2 with 17 seconds left against BYU. They were also prepared to implement such a strategy in games against Gonzaga if the situation arose. In two of the three games against the Zags, it nearly did.
But the fouling-up-2 approach was implemented on a hunch based on some back-of-the-envelope math. With play-by-play from tens of thousands of games at our disposal, Safir and I decided to use some down time to work through the math to pin down when this strategy makes sense.
We must warn readers that the calculations behind this investigation are not simple. We have provided charts near the end of this post that provide a guide on when to implement this strategy. If you trust us, or the details of our approach make your head hurt, you can skip to that.
For those of you that have stuck around, instead of just evaluating the foul-up-2 situation, we will be evaluating the foul-up-1 and foul-when-tied scenarios as well, since the procedure is similar. There will even be some discussion about fouling-up-3 if you’re into that.
To begin, it’s helpful to consider the issue at its most basic. We need to evaluate whether fouling up X (where X is 0, 1, or 2) with the shot clock off at the end of the game will yield a higher win probability than letting the game play out. We have a lot of real-world data on the latter but basically none on the former. Nonetheless, if we know the free-throw percentage of the player being fouled, we can determine the win probability for the fouling case from real-world events, as well.
There are two important variables to consider in this decision: the free-throw percentage of the player being fouled and the relative strength of the competing teams. In order to understand the importance of the latter, it is helpful to frame the chance of winning in these situations using the following formula.
p(W) = p(OT)*p(W|OT) + p(Reg)*p(W|Reg) ,
where:
p(W) is the chance of winning the game
p(OT) is the chance of the game going to overtime
p(Reg) is the chance of the game ending in regulation [equal to 1-p(OT)]
In plain English this means
the chance of winning equals
the chance of going to overtime times the chance of winning in overtime
plus
the chance of ending in regulation times the chance of winning in regulation.
By reframing the issue in this way, it’s apparent that the optimal choice is going to be partly influenced by how much one wants to avoid overtime. An underdog generally wants to find a strategy that avoids overtime, especially if it increases their chance of winning in non-overtime cases. (This way of thinking also has previously-unaddressed ramifications for the fouling-up-3 strategy. I will touch on that at the end of this post.)
USF used this equation to their advantage against BYU. By fouling a poor free-throw shooter when up 2, they reduced their chance of losing in regulation. And that was a serious threat given that BYU had one of the best offenses in the country built on great three-point shooting. (The Cougars were also 14-26 on 3’s to that point in the game.)
In order to pin down when to foul, we need a measure of relative strength of the competing teams. We’ll be using the pre-game win probability from my site for that. Even with 11 seasons of play-by-play data available, there’s still noise in the results so our pre-game win probability has been split into four overlapping groups: 0-40%, 20-60%, 40-80%, and 60-100%.
For each of the games in those groups, we compute the following three things for the team making the decision to foul, based on our formula above.
- p(W|OT) : The chance of winning in overtime given their pre-game win probability (This is the same regardless of strategy chosen.)
Then we find all cases where a team was up by 2 (or 1 or 0) and its opponent began a possession with between 15 and 30 seconds left in the game. From those cases we find the following for the non-foul choice:
- P(OT) : The chance of the game going to overtime
- P(W|Reg) : The chance of winning if the game ends in regulation
We use these three things to compute the chance of winning for the non-foul case.
For the case of teams with a 20-60% chance of winning pre-game (as USF was) and up 2, here’s what the historical data tells us:
- The team’s chance of winning in overtime given their pre-game win probability [p(W|OT) = .462]
- The chance of the game going to overtime [p(OT) = .301]
- The chance of winning if the game ends in regulation [p(W|Reg) = .863]
We can plug these into our original formula
p(W) = p(OT)*p(W|OT) + p(Reg)*p(W|Reg)
p(W)=.301*.462 + (1-.301)*.863
p(W)=.742
So the chance of winning when up 2 and not fouling is 74.2% for the team up 2 in this case (pre-game win probability between 20-60% with average win probability of 42%).
In order to know if fouling is the preferred approach, we need to compute the chance of winning after a foul. This gets a bit messy but play-by-play data can help us here, too.
For the foul case, we assume that the foul is given with between 10 and 15 seconds. For the case of the fouling team being up by 2, we compute the historical chance of a team winning with possession of the ball and a lead of 2, 1, or 0 (corresponding to the possibilities of the opponent making 0, 1, or 2 free throws).
To make things difficult, there are two other possibilities – the opponent could make either 1 or 0 and get an offensive rebound after missing the second free throw (or the first in the single-bonus). We find the historical chance of winning for those cases as well and assume an OR% consistent with history. For instance, a team that misses a free throw while trailing by 2 in the final minute gets an offensive rebound 25% of the time, well above the normal OR% on missed free throws, which is between 10 and 15% depending on the season.
The chance of the opponent making 0, 1, or 2 free throws is dependent on the ability of the opposing shooter and whether we are in the single- or double-bonus. Because of this complexity, we will not show the calculations needed to compute the chance of winning in the foul case.
But as an example, fouling a 69% free-throw shooter in the single-bonus will yield a win probability of .742. That’s identical to the value we got for not fouling, so 69% is the breakeven ability of the shooter to foul in the single-bonus this case. Foul a worse free-throw shooter and your win probability improves relative to not fouling.
That was the situation that faced San Francisco when they fouled BYU’s Yoeli Childs. Childs was a 54% free throw on the season and 63% for his career. Whichever value you feel best represents his true skill, fouling him increased USF’s chance of winning.
The reason for that is fouling only slightly increases the chance of overtime which USF wants to avoid because it’s a slight underdog and it’s currently in a favorable position with the lead. Going to overtime is a much worse result than just playing the game out.
Assuming Childs is a true 60% shooter, the chance of overtime only increases from 30.1% to 31.7%. But the chance that USF wins if the game doesn’t go to overtime goes from 86.3% to 91.1% based on history. And that assumes an average offensive rebounding team. (BYU ranked 344th in offensive rebounding last season – and in this specific case, they were playing a small lineup with their best rebounder at the free throw line.)
It is easier to see the comparison between the foul and non-foul cases by using this table and referring to our special formula:
          p(OT) p(W|OT)  p(Reg) p(W|Reg)  p(W)
Foul      .317   .462     .683    .911   .769
No Foul   .301   .462     .699    .863   .742
USF traded a little bit of overtime probability (which contained worse outcomes) for having much better chances in a regulation scenario. The foul itself boosted their win probability by 2.7%. Not huge but not trivial either. It’s often more than the decision to foul up 3 which gets exhaustively and enthusiastically debated every season.
The best way to distill this information for all cases is to plot the breakeven FT% for all bins for cases of a team being up 2, up 1, and tied when the opposing team starts a possession with 15-30 seconds left. Here are those graphs, the Pomeroy-Safir foul charts:

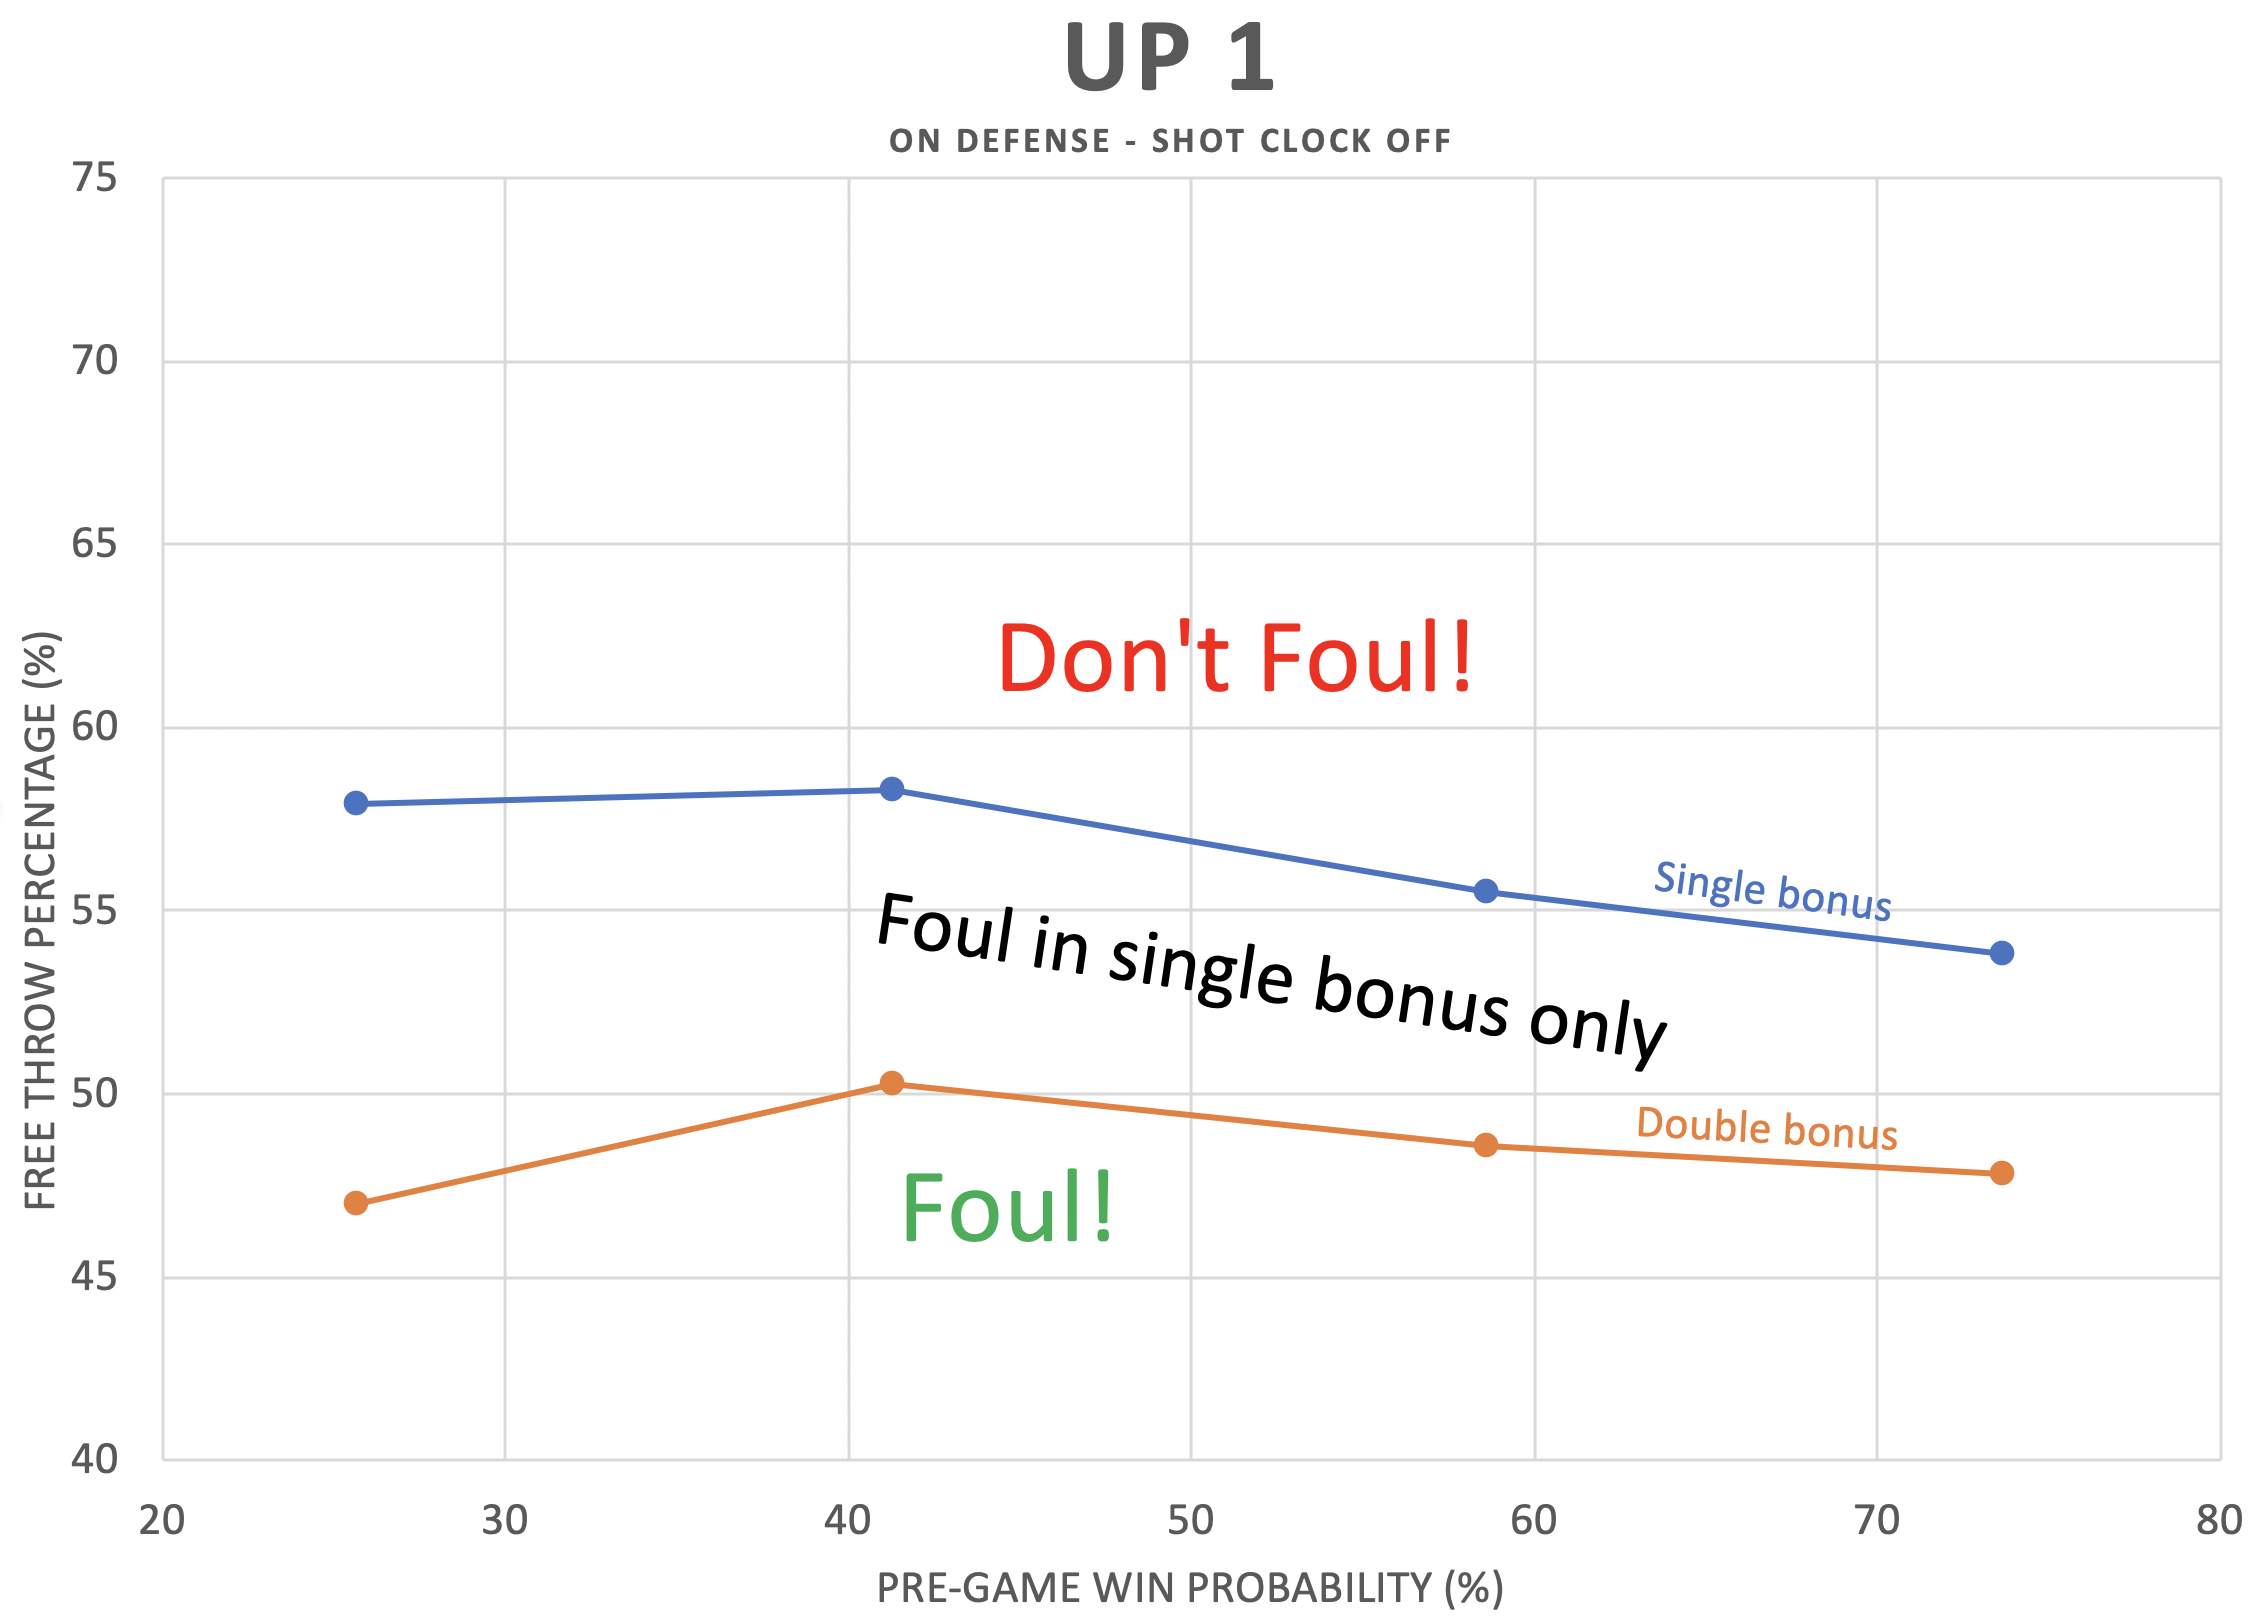
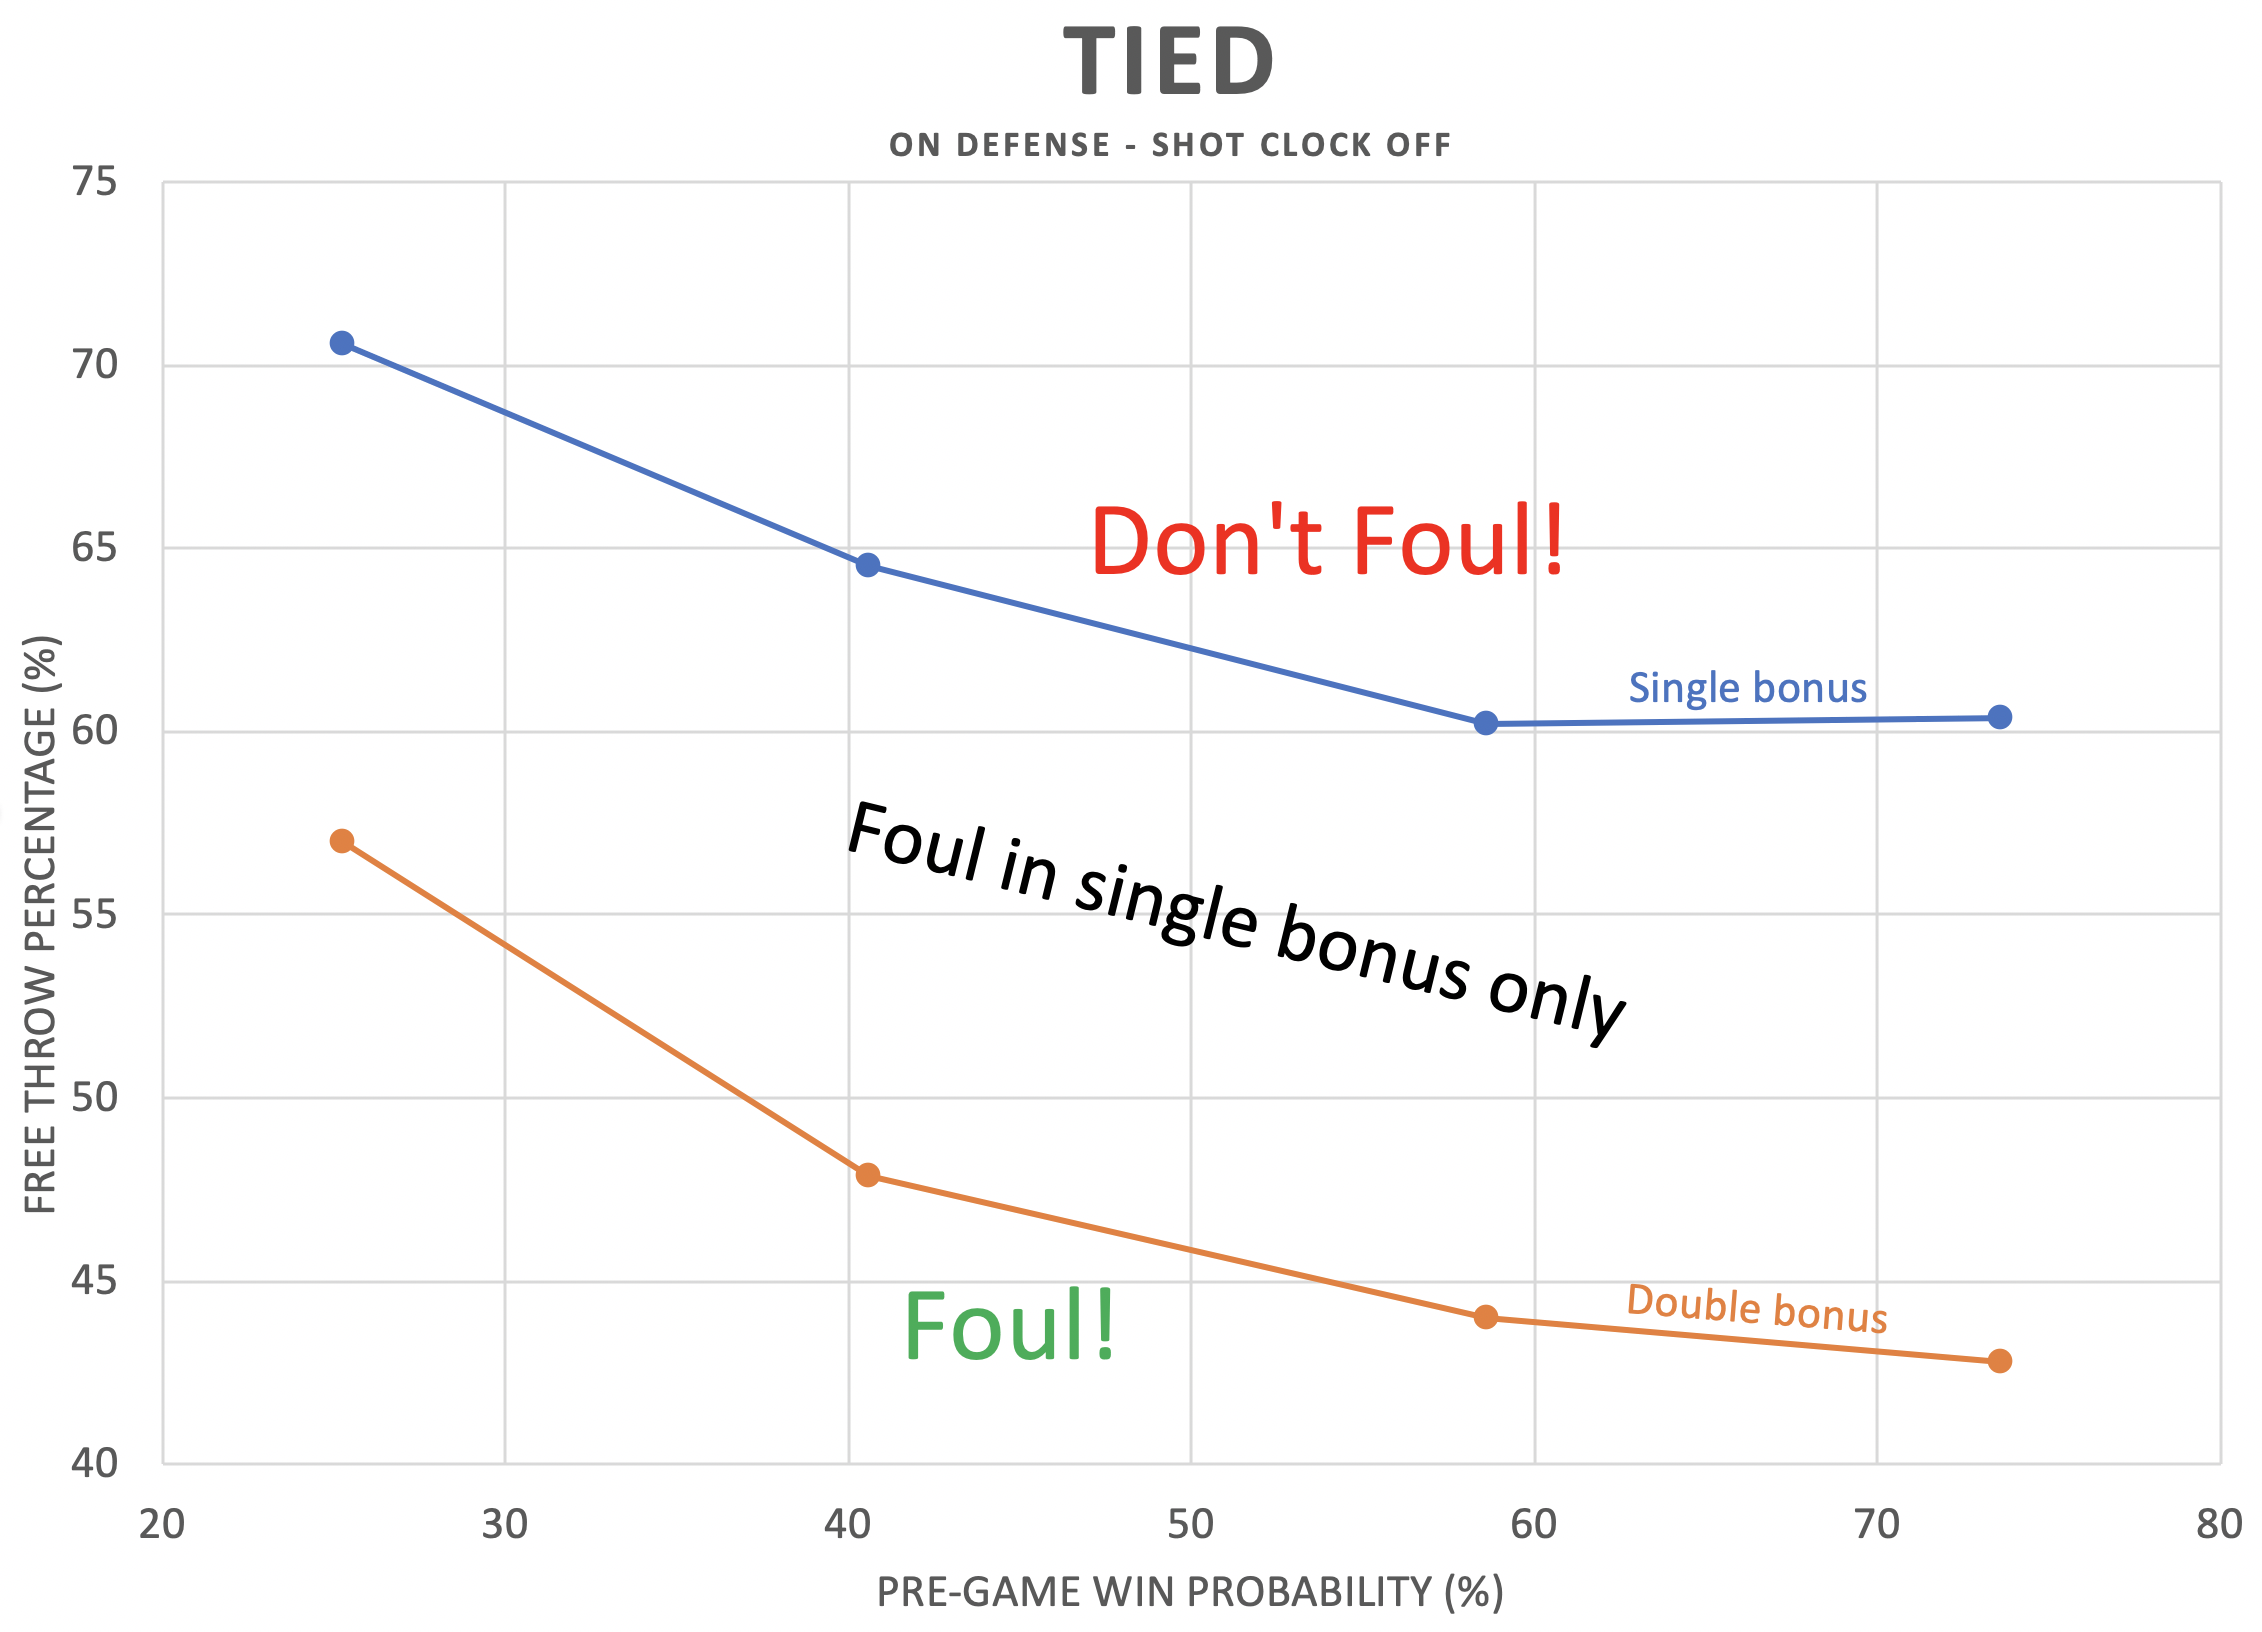
Click on them and print them out! Before a game, find where your team’s pre-game win probability intersects with the single-bonus and double-bonus lines to know what kind of shooter you need to foul to boost your chance of winning. Then just convince your head coach that math is on your side and you will get celebrated by the analytical community!
We see that the strategy is most viable for teams up 2, especially for underdogs in the single-bonus. As shown with the USF/BYU case, underdogs up 2 are trading only a slight increase in the chance of overtime for a significantly increased chance of winning in regulation when they foul.
The strategy is also quite useful for underdogs when tied in the single-bonus due to the chance of a poor free-throw shooter missing the first attempt and giving the fouling team the final possession in a tied game. In a tie game, fouling increases one’s chance of winning if the game ends in regulation and reduces the chance of overtime. So there’s a strong underdog effect here since they suffer more than a favorite in an overtime situation relative to ending a game in regulation.
We should note that when implementing this strategy, it’s important to consider that a player’s season-to-date free-throw percentage may not accurately represent his true ability. In particular, players are worse on their first free-throw attempt than their season average. In games involving power conference teams since 2010, players have made 67.4% of their first attempts and 73.1% of their second attempts in two-shot foul situations. That’s important in the single-bonus situation where the chance of making no free throws is extremely beneficial to the fouling team.
At any rate, the math is clear. When tied or up 2 on defense and the shot clock is off, teams can benefit from putting a below-average free throw shooter on the line. Especially underdogs in the single-bonus.
Ramifications for fouling up 3
We did not analyze fouling up 3 in this exercise because the dynamics of fouling up 3 are different than when fouling up 0, 1 or 2. In the latter cases you are trying to foul early enough to get the ball back with a reasonable chance to score again, if needed. That is not the case when fouling up 3. (In fact, fouling too early increases the chance of the fouling strategy failing.)
In past work on fouling up 3, I assumed that both teams had an equal chance of winning in overtime. However, in working through these calculations, we better understand that if one is a big underdog, then one has incentive to avoid overtime. My previous work found that fouling up 3 reduces one’s already small chance of overtime by about a third. (It slightly increases one’s chance of losing in regulation, but that’s a worthwhile trade for the big underdog.)
Regardless of where you stand on fouling up 3, it’s undoubtedly a worse proposition for a favorite than an underdog. That’s a consideration that I haven’t heard discussed previously.