

After months of uncertainty, it’s looking like a college basketball season will exist in some form. The number of games played will be limited and some conferences may not play a non-conference slate.
However, there is a misconception promoted by the media and the highest levels of the NCAA, that without non-conference games one cannot use objective data to select and seed teams for a postseason tournament. In reality, almost every other ratings system besides the NET will produce ratings this season, even for teams that do not play non-conference games, because it’s not a very difficult obstacle to overcome.
College basketball has always been an outlier in the sports world in using opinions to influence who makes its post-season tournament. If subjective opinions are used exclusively, this season will be even worse. In the event of no or very few non-conference games, how does one compare a 10-10 Big East team to an 11-7 Pac-12 team to a 16-0 MAC team using the eye test? It is a bizarre exercise to consider.
At least in the past there’s been a historical standard that is loosely understood by the participants even if nobody can precisely explain it. This season there may be no standard. Just ten sets of eyes to make a guess as to which team is most deserving. Do wins and losses matter? Do style points matter? Nobody knows and that’s not fair to participants in the game, and thus the game itself.
Pandemic or no, the NCAA should be moving away from subjectivity when it comes to selecting teams. Making decisions purely with one’s gut is a risky exercise. And unfortunately, people who express the most confidence in their intuition often seem to be the worst at using it. We have seen that principle play out in a role fundamental to college basketball administrators – the colleagues of people on the selection committee – and that’s the hiring of head coaches.
Per the nifty NCAA Demographics Database, 28% of D-I head coaches in 2019 were Black. At non-HBCU’s, this figure is 24%. That 24% of non-HBCU head coaches are Black contrasts sharply with the fact that Blacks make up 53% of players and 46% of assistant coaches. In 2019, 6 of 27 (22%) non-HBCU coaching hires without prior D-I head coaching experience were Black.
Whether this is the result of overt racism or subconscious bias is beyond the scope of this piece. But you have to tie yourself into a serious logical knot to believe that African-Americans are qualified to be assistant coaches, but not head coaches. However, people will tie themselves into those knots.
Sadly, it appears coaching hires are often made by the eye test. For head coaches with previous experience there is an actual track record with wins and losses to consider. But for aspiring assistants, there clearly isn’t as much data.
Well, there is some data. The most important thing for a college basketball program is getting players. Whether it’s the five-star high school player or the undervalued gem that is the perfect fit for a particular system, having great players supersedes strategy. The best strategic coach is not going to win without talent. But the evidence indicates that athletic directors tend to ignore skill in recruiting in favor of focusing on a coach’s strategic knowledge.
This is not to say that White coaches are better with strategy than Black coaches. But there’s no doubt that basketball people, whether media or fellow coaches, think so. This 2013 piece from espn.com polled D-I head coaches to name the top 25 X’s and O’s coaches. And 24 of them were White. (Actually two other coaches received enough votes to make the list – Stevens and Ben Howland – but were excluded because they weren’t active college coaches. So make it 26 of 27.) This 2015 ranking from coachstat.com seems to be well-thought and thoroughly researched but lists 25 White guys among its top 25 X’s and O’s coaches.
In all there are 44 unique names on these lists and 43 are White. (Congrats, John Thompson III.) Now, there aren’t a lot of Black head coaches to begin with, so you wouldn’t expect a lot of diversity. Still, with 24% of non-HBCU head coaches being Black, and these lists having just 2% of Black head coaches, we might want to re-examine our biases in this area.
Now, wisely, nobody appears to have made such a list in the last five years. Because as you can see, people (other coaches, no less) either think Black coaches aren’t qualified for such consideration or they have a blind spot. I would invite anyone to try to come up with an objective way to measure in-game coaching performance that produces a list where the top 25 coaches are White. (I’ve tried and found no racial trend.)
But administrators, tasked with finding the person to run their multi-million dollar basketball program, have a clear bias in selecting coaches. And that’s just one way the eye test fails in a profound way. We could name others – and have on this blog from time to time – but let’s get to the point: Playing basketball in a pandemic shouldn’t require teams to have to choose between scheduling the maximum number of games and risking the spread of a highly-contagious virus without a vaccine just for the sake of helping out ten people who want more games to watch.
And it doesn’t have to be this way. In the event no non-conference games were played, the simplest fix to make a ratings system work would be to give teams from each conference their own ratings baseline. I’d use my pre-season ratings to establish this baseline but the NET doesn’t have pre-season rating. However, one could also do this with the average of previous seasons of a conference’s rating. (The trick is you have to use the current conference membership to compute those ratings.)
One might say that it’s unfair to assume a certain conference will be better than another. Under normal circumstances, perhaps. But unusual circumstances require creative solutions. And this works well in practice. The ACC has never been worse than the WCC on average, despite the fact the WCC usually has a team that would be capable of competing for an ACC title. We know that the Big Ten will be better than the AAC, which will be better than the Mountain West, and all of those leagues are always among the top ten conferences.
To illustrate how well this works, let’s first look at how my pre-season ratings have fared for both teams and conferences over the past decade.
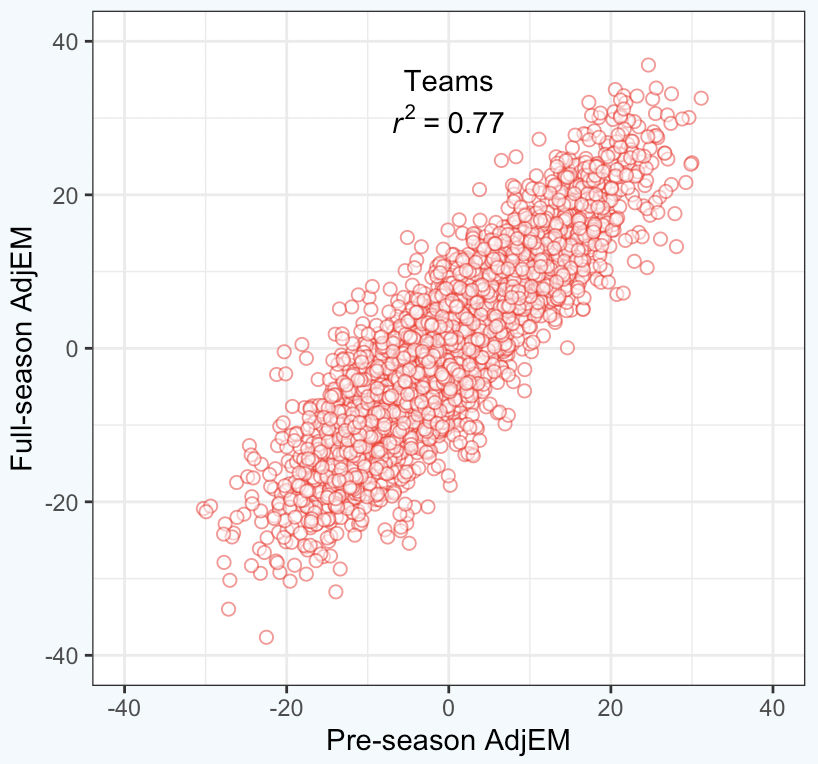
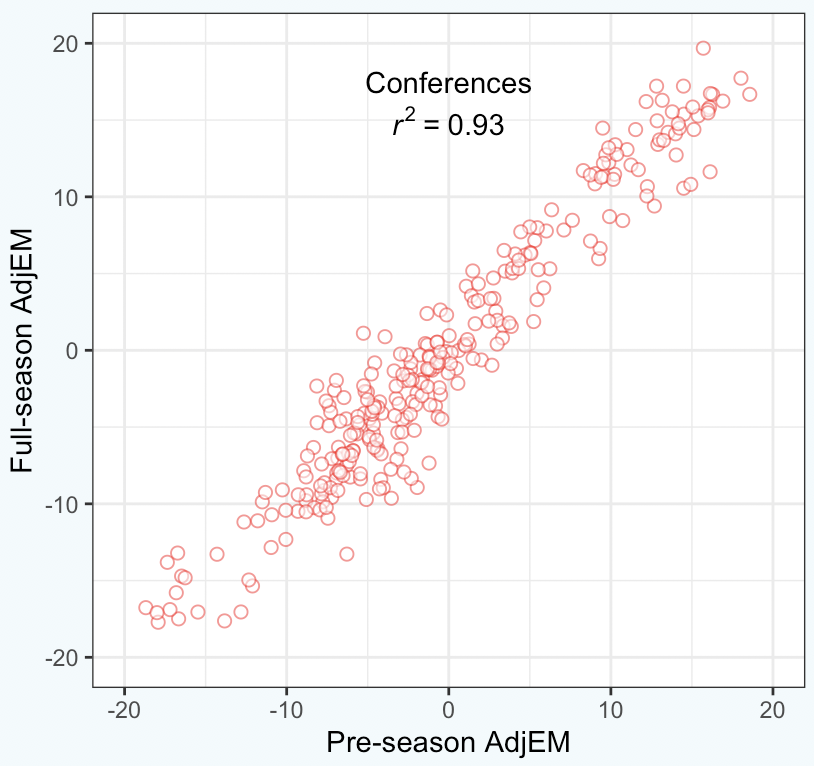
They are significantly more accurate predicting the end-of-season rating for conferences, which shouldn’t be surprising. The errors for each team are random, and if you group a bunch of teams together, those random errors tend to cancel out.
It’s more interesting to look at past seasons to see what the ratings would look like in a situation where no non-conference games were played and this method was used.
Here’s a summary from 2019:
                   Reg. Season      Conf-only
           Team      Rk  AdjEM    Rank  AdjEM
       Virginia       1  35.65       1  36.58
        Gonzaga       2  32.86       2  35.69
           Duke       3  31.96       7  29.46
   Michigan St.       4  31.11       3  32.48
       Michigan       5  29.67       5  29.85
 North Carolina       6  29.19       4  30.26
      Tennessee       7  28.33       8  27.76
       Kentucky       8  27.48       6  29.51
     Texas Tech       9  26.77      10  26.94
         Purdue      10  26.04       9  27.49
The data on the left are the actual ratings prior to the field selection and the numbers on the right include just conference games using the baseline method (and conference tournaments). It’s neat that each of the top ten teams is still in the top ten even using limited data with no cross-conference information. We have less data and yet, for practical purposes, the top teams end up where they would have been with a full season.
That’s just the 2019 season and I have done preseason ratings since the 2011 season. But I lost the ratings for that season so we’ll have to settle for data since the 2012 season. Over those eight years, an average of 8.6 teams from the actual top ten ended up in the conference-only top ten.
Going deeper, there were 14 teams that finished in the top 25 of either the actual ratings or the conference-only scenario and had a ranking difference of at least ten spots between the two. So only about two per season:
 Season Seed              Team Actual ConfOnly     diff
   2012    8          Iowa St.     31       17      +14
   2012    5        Vanderbilt     18        8      +10
   2013    6           Arizona     17       28      -11
   2013    6           Memphis     34       23      +11
   2013   11         Minnesota     23       39      -16
   2013    5               VCU     20       33      -13
   2014    5          Oklahoma     29       17      +12
   2016    4              Duke     14       28      -14
   2016    -        Louisville     10       20      -10
   2016   14 Stephen F. Austin     44       17      +27
   2017    6               SMU     14        3      +11
   2018    7            Nevada     24       39      -15
   2018    5          Ohio St.     15        5      +10
   2019    4        Kansas St.     23       11      +12
And there were 17 teams that finished in the top 50 of either the actual ratings or the conference-only scenario and had a ranking difference of at least 20 spots between the two.
 Season Seed              Team Actual ConfOnly     diff
   2012   14               BYU     49       69      -20
   2012    -  Middle Tennessee     47       82      -35
   2012    6        Murray St.     38       61      -23
   2012    -            Oregon     71       49      +22
   2012   12     South Florida     59       39      +20
   2012   14   St. Bonaventure     66       46      +20
   2012    -         Tennessee     56       34      +22
   2012    -              UCLA     64       44      +20
   2013    9         Villanova     54       31      +23
   2014   13             Tulsa     79       47      +32
   2014    -           Vermont     74       42      +32
   2016   14 Stephen F. Austin     44       17      +27
   2018   11       Arizona St.     45       86      -41
   2018    -          Nebraska     57       30      +27
   2018    7         Texas A&M     30       59      -29
   2019    9          Oklahoma     38       59      -21
   2019    -    South Carolina     73       48      +25
There just aren’t a bunch of huge changes. (Somehow 8 of the 17 cases on this list occurred in 2012 alone, which could be the result of my preseason ratings being not as good back then. But also seven of those cases involved a ranking change of between 20 and 23 spots.)
Now you might say, Stephen F. Austin was not the 17th best team in the country in 2016, Ken. Would you give them a five-seed with this approach? Well, first I’d say that it’s awfully rude of you to judge my work on the worst example among many good ones. Like, maybe I should go to your job and watch you do the thing that you do like 300 times and then find the worst one of those 300 and tweet to your boss about it.
But also, my ratings are not designed to pick teams for the tournament. It should be used as a very good estimate for how difficult it is to beat a particular team. (This is something that humans seem to be not very good at judging.) Beating SFA would have been viewed as beating the 17th-best team. Nobody beat them in conference play that season anyway, so the question is moot.
Armed with the knowledge of how difficult every win is for every game played by every team, you can use any number of approaches to figure how impressive a team’s record is against its schedule. We can compare teams that play 13 games to teams that play 25 games. We can compare teams that play no non-conference games to teams that do. No program has to feel pressure to schedule a ton of games in these challenging times in order to impress the selection committee.
Nor do we have to worry about top 50 and top 100 wins. And through no fault of their own, some very good teams may not get the chance to play any games against that kind of competition this season.
My final plot is a comparison of the ratings from the COVID scenario to the actual pre-tourney ratings.
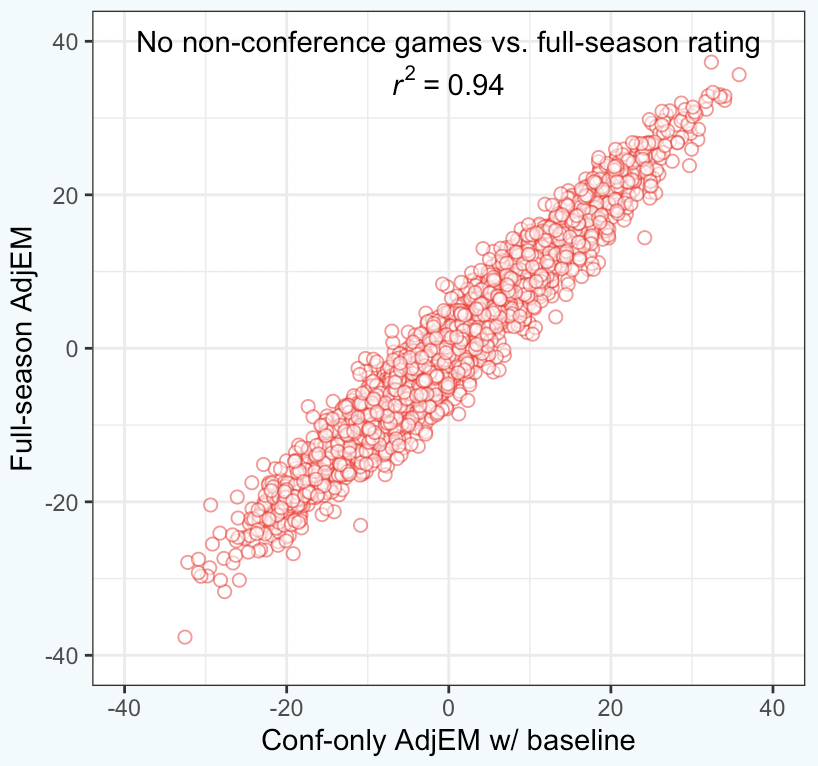
Obviously there are differences. But considering the limitations placed on the system – no conference connections and about 40% less data – it’s acceptable.
Could ten humans do better? They’d be fine getting the top teams mostly correct. Though I don’t think they’d be exclusively using the eye test for that. We know which conferences are best year-in and year-out and we can look at the top of the conference standings to get an idea which teams are best. But figuring out the last at-large teams, which comes down to distinguishing the difference between the 44th and 45th most-accomplished teams, is an impossible human task even in a normal season.
No doubt a few non-conference games will help both the subjective and objective approaches. (Although, just because a few non-conference games will be played doesn’t mean the principles discussed here wouldn’t need to be implemented.) If these games can be played safely, great. But they don’t need to happen simply to appease the eye-testers.
Whether it’s hiring coaches or determining the whether a college basketball program gets a chance to earn a massive payout and publicity by making the tournament, there’s always been a lack of humility regarding how fallible human decision-making can be when ignoring available objective data. Eventually this will change. We are closer than we were before. But the attitude heading into this season suggests we are still not very close at all.