

It seems that each college basketball season we are force-fed some sort of overarching narrative. Sometimes it’s about the dominance of one particular team, a la Kentucky in 2014-15; other times it’s about how relying on one-and-done talent isn’t a winning strategy and experience reigns supreme. This year, we’ve all come to the conclusion that parity is at an all-time high. Ironically, this claim has been rather common in recent years.
Truthfully, this narrative doesn’t sound too implausible. One of the most cited stats to back the parity claim is the number of AP #1s that have lost this season. Michigan State, Kentucky, Duke, Louisville, Kansas, Gonzaga and Baylor have all already been crowned #1 by the AP Poll at one point this season. However, it stands to reason that if the parity claim is to be taken seriously, we must do a bit more digging to find evidence. In my opinion, there are two important questions we need to ask.
1. Is the number of #1 AP losses in itself particularly extraordinary?
While it is somewhat interesting that it is the 9th time since the establishment of the AP poll that at least 6 different teams have been atop the Poll, the actual events leading to this stat are not immediately indicative of parity.
For example, the first #1 to lose its spot was Michigan State, who was defeated by #2 Kentucky on a neutral court in both teams’ first game of the season. Given that a #2 beating a #1 practically guarantees the #2 team the top spot in the next AP poll, a 1/2 matchup on a neutral court to start the season is about as close as you can get to flipping a coin to decide whether the #1 team should be dethroned after just a single week.
Kansas (at the time KenPom #4) losing to Villanova (at the time KenPom #19) in a nail-biter and Louisville (at the time KenPom #2) losing to Texas Tech (at the time KenPom #29) are not mind-blowing results. Both Kansas and Louisville were favored in their respective games, but they were facing highly ranked opponents in tough early-season matchups. These are not games that should be fueling league-wide narratives.
The only two games in the set of AP #1 losses that had rather uncommon results are Kentucky and Duke’s losses to Evansville and Stephen F. Austin, respectively. That being said, as shocking as these two games were, I remain hesitant to proclaim parity in the wake of a couple of 1 point upsets.
2. Do other aspects of the 2019-20 AP polls point to an abundance of parity in the league?
If parity means that there is equality or similarity in ability between teams, and if it is indeed present in college basketball, it seems likely that it would be reflected in weekly polls. A bunch of evenly-matched teams playing each other would make it difficult to assess the true skill of each individual team, resulting in a lot of change in the polls from week to week compared to seasons in which there are clearly dominant teams that are easily ranked above others.
We’d probably expect to see many different teams receiving votes in the polls and new teams appearing frequently. Up to week 9, however, there have only been a total of 73 different teams that have received poll votes this season, which is tied for 4th least since 2010. I should note that I did not include teams that only received votes in the preseason poll in these totals since preseason votes are cast before voters see teams play even a single game.
Teams receiving votes in AP poll through week 9
          Season  Teams
           2010     88
           2015     82
           2016     82
           2018     79
           2012     75
           2017     75
           2019     73
           2020     73
           2011     70
           2014     66
           2013     62
In 2010, the AP poll began reporting the actual number of “points” that each team received from the voting panel in a given week. By tracking every team’s week-over-week point change, we can measure the variability of the polls in a specific time range. The graph below visualizes how much the 2019-20 polls have varied from one week to the next in comparison to other seasons since 2010:
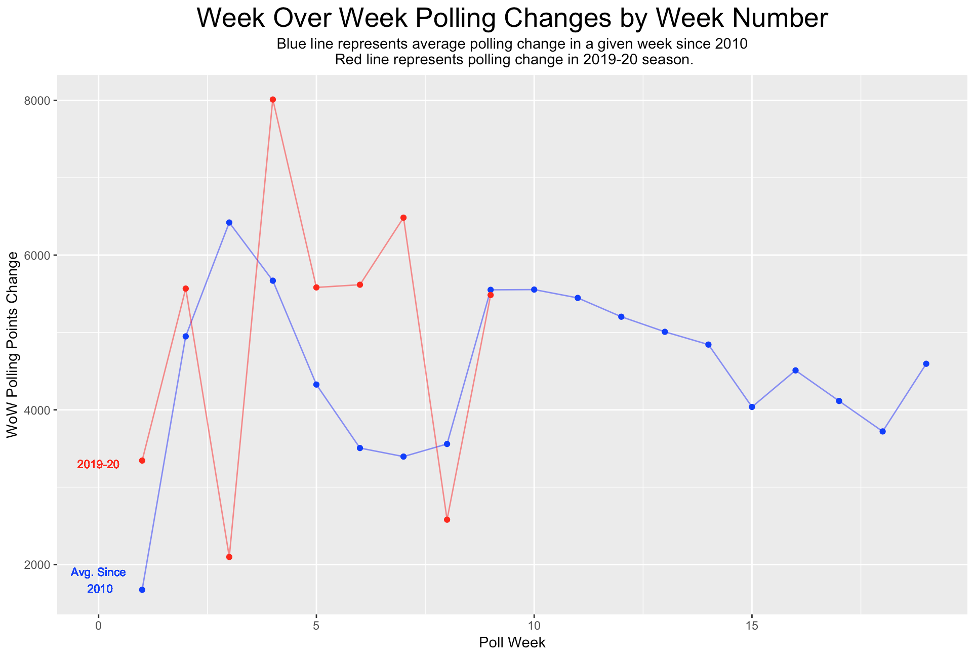
One particularly interesting thing about this graph is the story that the blue line, representing average week-over-week polling point changes since 2010, tells about polling trends over the course of a season.
There is a peak in the line at the beginning of the season corresponding to an initial uncertainty about the relative strengths of teams due to a small number of games played. It is common for teams who were ranked highly in preseason polls to lose ground quickly if they have shaky starts, while initially ignored teams can gain a significant number of points by managing to pull off even a single unexpected win.
After polling variation spikes to start the season, it sharply decreases; I gauge this might be a result of non-conference play winding down at the end of the calendar year with fewer games played and major conference teams handling easier schedules against inferior opponents.
Finally, there is another large spike in polling change in week 9, which falls around the beginning of conference play, potentially a sign of increasing uncertainty about the strength of certain teams as they begin their more competitive and condensed conference schedules. There is a slight decline in week-over-week polling variability over the course of conference play, but it still remains quite high until the tournament starts.
Looking at how week-over-week polling variation in 2019-20 compares to prior seasons, it’s not clear if this season has historical levels of parity. While certain weeks had higher than average polling change, others simply did not.
Below is each season’s sum of week-over-week polling variation up to week 9. This metric perhaps lends a bit of credence to the parity narrative with the 2020 season having the 3rd highest total polling variation, but 2010 and 2011 are quite close behind.
Week-over-week polling variation in AP poll through week 9
          Season  Change
           2018   43529
           2016   42209
           2020   41423
           2010   41270
           2011   41216
           2015   36886
           2012   34997
           2014   34569
           2019   33499
           2013   33282
           2017   32314
At best, the claim of parity in college basketball this season is murky. As fans, we tend to have a short memory span when it comes to things like upsets even though they are quite common in college basketball. Games are not played on paper; strong teams can underperform in a single game, and weak teams can over-perform. Toss in the fact that we sometimes just do not know the true ability of a given team, and you are bound to get some unexpected results.
This season seems to have above ~average~ parity, at least compared to the last decade or so, but the AP Poll, which tends to be highly impacted by unexpected game results, doesn’t support the idea that teams are historically balanced. We should enjoy the excitement that upsets bring to college basketball while also being careful to not make it more than it is.
If you feel differently about this season’s parity level, reach out to me on Twitter.