

Continuing the discussion from yesterday, let’s look at more scatterplots! We’ve looked exclusively at defense so far and in order to get a better understanding of how defense works, we need to look at both sides of the ball. Because clearly the offense has some control over what happens on each possession as well.
To get our bearings, let’s look at something that the defense should have more control over compared to the offense – blocked shots. In all of the subsequent pairs of plots, the offensive plot will be on the left and the defensive version will be on the right. Here’s blocked shot percentage:
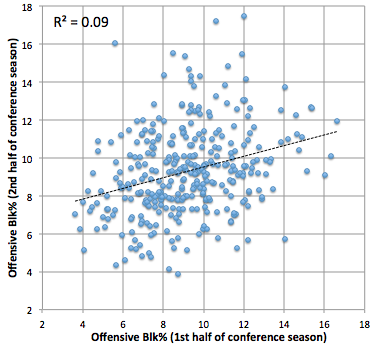
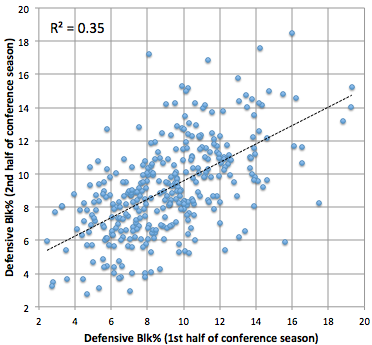
This makes some sense. Defensive block percentage is a better predictor of the future than offensive block percentage. Basically, a defense’s ability to block shots is greater than the offense’s ability to avoid them. Anthony Davis and Fab Melo will generally get theirs regardless of opponent. However, the offense does have some skill to avoid blocked shots and, since we ignore three-point attempts in this calculation, I expect most of that ability depends on being tall.
Let’s check out free throw percentage.
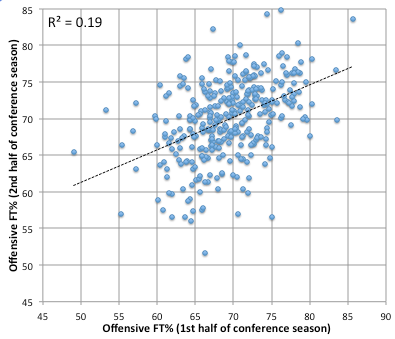
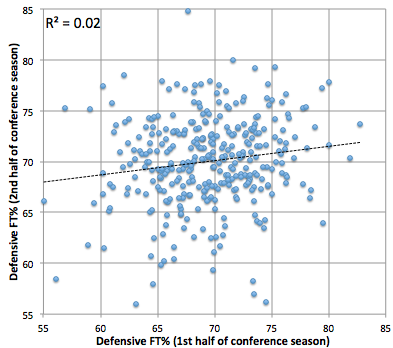
Some positive slope for the defense but overall these plots look reasonable.
Now for 2-point percentage. If the defense doesn’t have influence on FT% or 3P%, it better have some influence on this.
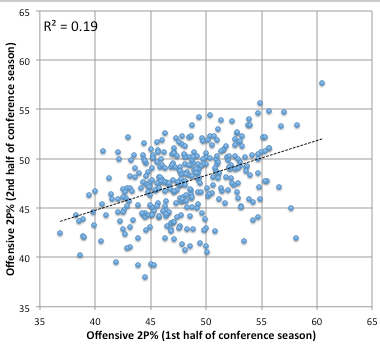
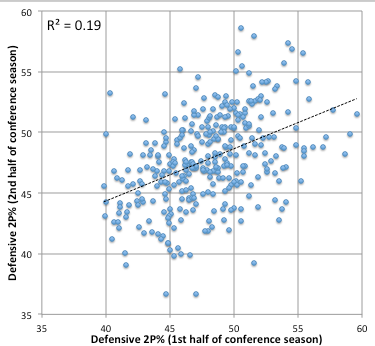
Alright, life is starting to make sense. There are nearly equal values for R2 and the slopes of the regression are almost identical. In fact, the defensive slope is just a wee bit greater. This is an equal battle between the offense and the defense. Both clearly have skill at influencing 2P%.
Before we get to the payoff, let’s compare 3PA%.
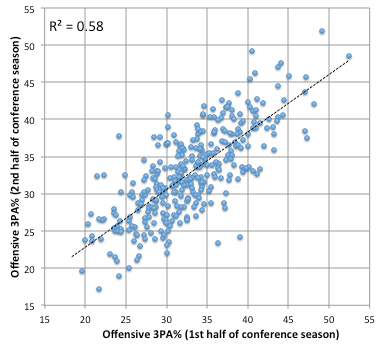
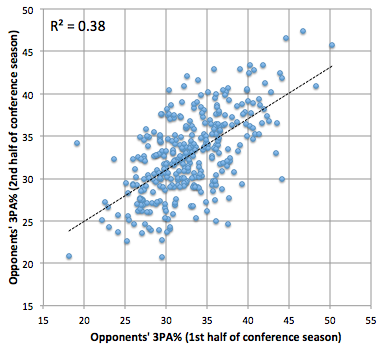
3PA% is one of the most predictable shooting-related stats around. We’ve already established the defense has influence over this, but a major part of an offense’s style is how often they want to shoot threes, so they have influence, too. More influence than the defense, actually.
Now the payoff: 3P%.
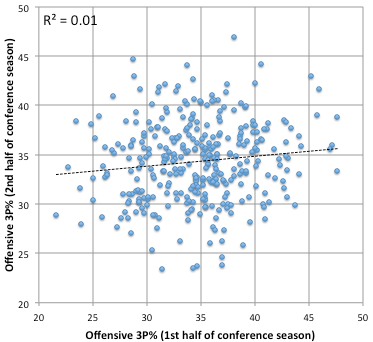
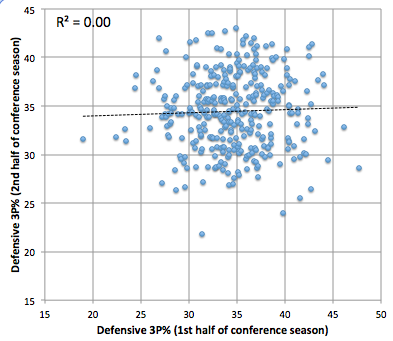
Oh dear. The defensive plot is just a random scattering of data, as has been discussed previously, but the offensive version isn’t much better. If you shot 45% in the first half of the 2011 conference season, you’d be expected to shoot about 35% in the second half. If you shot 25% in the first half, you’d be expected to shoot 33% in the second half. A difference you couldn’t notice with your eyes. I don’t know exactly what implications this has on strategy, but when evenly-matched teams get together, action happening beyond the 3-point line is like a lottery. You take a shot and a third of the time you have success.
Of course, there are games where good shooters get a bunch of open looks and they make more than a third of their attempts. You wouldn’t call that luck. (Although, from the offense’s perspective the shooters enjoyed some good fortune to be left open.) But in the long run, that kind of stuff evens out a lot more than I would have thought. In the end, coaches have to decide how much they want to play the lottery. Sometimes, it will be advantageous for the defense to let the offense play the lottery a bunch and sometimes it won’t. The offense has to consider the same things.
John Beilein loves to have his offense play the lottery while Roy Williams hates it. Tubby Smith is cool with opposing offenses playing scratch-off tickets, while Rick Majerus forbids it. If you’re Shaka Smart and you have to play a series of teams better than you in March, it stands to reason that you’ll be willing to play the lottery on offense all game long, six games in a row.
Each philosophy may be correct given the alternatives inside the arc. There are obviously a lot of factors for a coach to consider in making these decisions, many more than just what a team’s 2-point accuracy might be. Nonetheless, it’s an interesting way to think about how defenses (and offenses) work.