

Tracking 330 teams is the maddening part of following college basketball, but the strength of the sheer volume of teams is that, when taken as a whole, you get a great idea of how the game is played in general. There is a tremendous variety of decisions being made by 330 coaches and their players, some good, some bad. But they all think they are making the right decisions. After all, this isn’t a simulation they are playing, each coach has his livelihood on the line. So in the end you have a well-developed consensus on how the game should be played, given the talent pool, the current set of rules, and how the game is called.
A review of last season’s stats shows two trends continue to stand out more than any other. First, the average game in 2005 was slower than it was in 2004, setting a standard for lethargy that hasn’t been matched in decades.
Second, for the 18th consecutive season, the three point shot was used more than the previous season.
To steal something from Ryan’s playbook, here is a chart of efficiency, tempo, and shooting in the college game since 1948, with key rules changes highlighted:
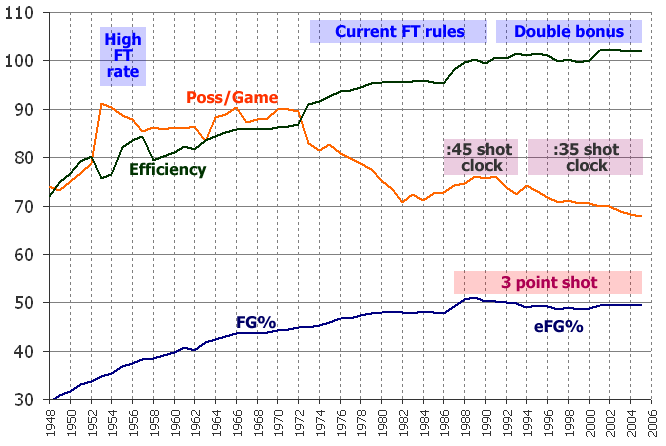
This is based on data provided by the NCAA. Because they only supply the major statistics, it takes a fair amount of estimating to come up with possessions. So don’t take the numbers too literally, especially before 1973. But I think they are in the ballpark and capture the long-term trends accurately. I needed to estimate turnovers, free-throw possessions, and offensive rebounds and there are some details on my assumptions at the end of this post (including a thrilling discussion of the free throw multiplier). In the meantime, some observations.
Efficiency had historically risen before leveling off in the early ’80s. Some variation in it has been subject to rules changes over the years. Efficiency was depressed from the general trend in ’53 and ’54 and from ’58 to ’72 when free throw rules penalized the offense. And then there was a jump in the last twenty years with the implementation of the three-point line.
Shooting percentage has generally increased over time as well. I used effective field goal percentage since 1987 which accounts for the added value of made three-pointers. Raw field goal percentage has trickled downward since ’87, but then again, players are shooting from farther away.
Tempo has seen two separate eras: up to the mid ’70s it was amazingly fast by today’s standards, averaging between 80 and 90 possessions a game. The progression of field goal percentage explains much of this. Basketball was a chaotic chuck-and-duck brickfest until the game evolved into a more methodical affair in the late ’70s and early ’80s. The dramatic slow-down during this time prompted the NCAA to experiment with, and eventually add, the shot clock and three-point line. There was an initial increase in tempo in response to the shot clock, but the game has been slowing down since 1994, and reached an all-time low in 2005.
One shouldn’t confuse tempo with excitement. The two are loosely related, but in the mid ’50s when tempo was through the roof, action was limited with games averaging around 60 free throw attempts. I doubt that too many fans have really noticed the 10% decline in possessions over the past decade. Those paying close attention have noticed more scores in the 50s and 60s than there used to be. And it’s pretty clear that just like in the mid ’80s, significant rules changes are coming soon to try and halt the tempo and scoring slide. But I’ve talked about it ad nauseum – the experiments that have been tried in the last two seasons have resulted in an even slower and lower-scoring game.
As defenses have improved, teams are been more willing in recent years to take longer to hold out for a three. At least, that’s what I suspect is at the root of deceleration. Here’s a plot of the percentage of all field goal attempts taken as three-pointers since the arc was painted for the 1987 season.
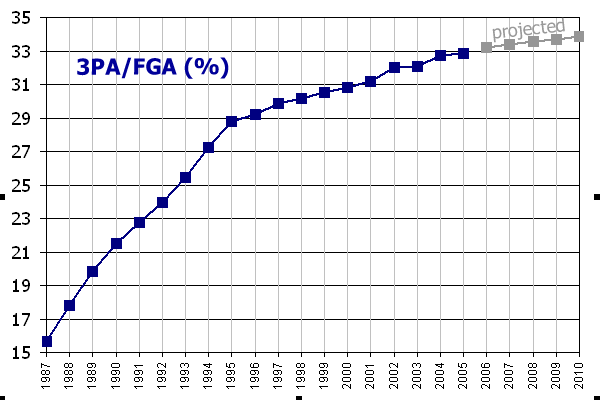
I feel fairly confident we will see the three-point line moved back soon, specifically for the 2007 season. Hopefully it will be accompanied by an NBA-like crackdown on perimeter contact. Otherwise, present trends will continue. The three-point shot is the slingshot that slays Goliath, and there are a lot of Davids out there with plenty of slingshots to go around.
–
Here are some sketchy details on the estimates used in the possession computations:
Turnovers, seem to be weakly a function of shooting percentage – as shooting percentage decreases so do turnovers. So a slightly lower turnover rate was assumed for olde tyme basketball. Since I don’t know how well people took care of the ball decades ago, I didn’t make this relationship very strong. About 22% of possessions ended in turnovers in 2005. For example, in 1948, when less than 30% of field goal attempts were successful, I assumed a turnover rate of 19%.
Offensive rebounds are weakly a function of three point shooting and reboundable free throw misses. Before 1987, there isn’t three-point data, so I assumed a slightly lower offensive rebound rate on twos than we see today.
Free-throw possessions are the most difficult thing to estimate and by far took up most of my time in doing the computations. It was somewhat productive in that a chain of events forced me to look at what the modern-day multiplier should be. Throughout my brief stint in computing possession stats, I have used .42 as the free throw multiplier. It splits the difference between the figure used by Dean Oliver (.44) and John Hollinger (.40). I had no reason to pick one over the other, so I compromised. After doing a little work that only scratches the surface of what should be done, it looks like the number for the college game should be .46. This makes sense if you assume that Oliver’s number is correct for the NBA. The NBA doesn’t have one-and-one opportunities, and every missed front end of the bonus drives the multiplier higher. There are somewhere between two and three of these per game in college, so a nudge up to .46 sits well with me.
Before 1973, when the current rules (save for the double-bonus change in ’91) were adopted, free-throw rules are murky. The mid ’50s featured an explosion in free throws when they were shot on every foul. Anyone who can enlighten me further will be appreciated. I have read the NCAA Record Book summary of rules changes, so if you have some knowledge beyond that, [email protected].
It should be noted that the actual efficiency for the 2005 season was 100.5. The estimate from the NCAA data is 102.1. For 2004, the efficiency numbers are 100.3 and 102.0, respectively. Part of this bias stems from the NCAA using data from games against non-D1 teams, whereas I don’t. But that difference is a little larger than I am comfortable with.