

There’s been quite a bit of recent discussion on this blog on the topic of three-point shooting. (Here, here, here, here, and here.)
There are two key takeaways from these articles: First, that it’s really hard to predict a team’s three-point percentage for a game, even knowing how well they tend to shoot three-pointers, and second, that to rate shooters against each other we need to keep a close eye on frequency of attempts as well as percentage. What I’m about to show you demonstrates that the difficulty of projecting three-point percentage also exists on the year-to-year player level and that we really need, as a basketball society, to move away from pure three-point percentage as the measure of a shooter.
The four tables that follow consider only the 335 players who attempted more than 100 three-pointers in both 2011 and 2012. So there’s certainly some selection bias in these numbers: If you shot poorly on 100+ shots in 2011, you don’t show up in the dataset if your coach’s response is to cut down your attempts. If you went pro after 2011 or redshirted in 2012, you’re not here. There are issues, yes, but that shouldn’t take away from the message here. “3PS” refers to Three-Point Score, which is outlined in the first linked article above. “3PR” refers to Three-Point Rate, which is the number of three-point attempts taken per team offensive possession.
3P%11     # 3P%11 3PR11 3PS11  3P%12 3PR12 3PS12
<.3      19  .279 .088  1.007   .343 .092  1.026
.3-.35  101  .329 .103  1.030   .348 .106  1.038
.35-.4  133  .374 .103  1.048   .371 .105  1.045
.4-.45   71  .422 .100  1.069   .389 .107  1.054
>.45     11  .474 .107  1.099   .374 .115  1.052

3PR11       # 3P%11 3PR11 3PS11  3P%12 3PR12 3PS12
<.07       36  .351 .065  1.021   .354 .079  1.026
.07-.095  117  .370 .085  1.036   .366 .092  1.035
.095-.12  112  .371 .106  1.049   .371 .111  1.048
.12-.145   50  .374 .131  1.064   .365 .125  1.053
>.145      20  .363 .163  1.095   .372 .145  1.078

3PS11         # 3P%11 3PR11 3PS11  3P%12 3PR12 3PS12
<1.015       21  .284 .077  1.007   .339 .090  1.025
1.015-1.04  139  .347 .092  1.028   .361 .097  1.037
1.04-1.065  108  .386 .105  1.050   .372 .109  1.045
1.065-1.09   45  .404 .120  1.074   .373 .118  1.055
>1.09        22  .427 .134  1.123   .389 .127  1.076

Correlations:
11/12 3P% 3PR 3PS
3P%   .29 .09 .22
3PR   .06 .73 .44
3PS   .22 .42 .45
The guys who shot over 45 percent in 2011 shot 37 percent in 2012. The guys who shot under 30 percent in 2011 shot 34 percent in 2012. Having a high three-point percentage is always a positive, but it’s not particularly indicative of future success. Here’s the three-point percentage 2011 & 2012 scatter plot:
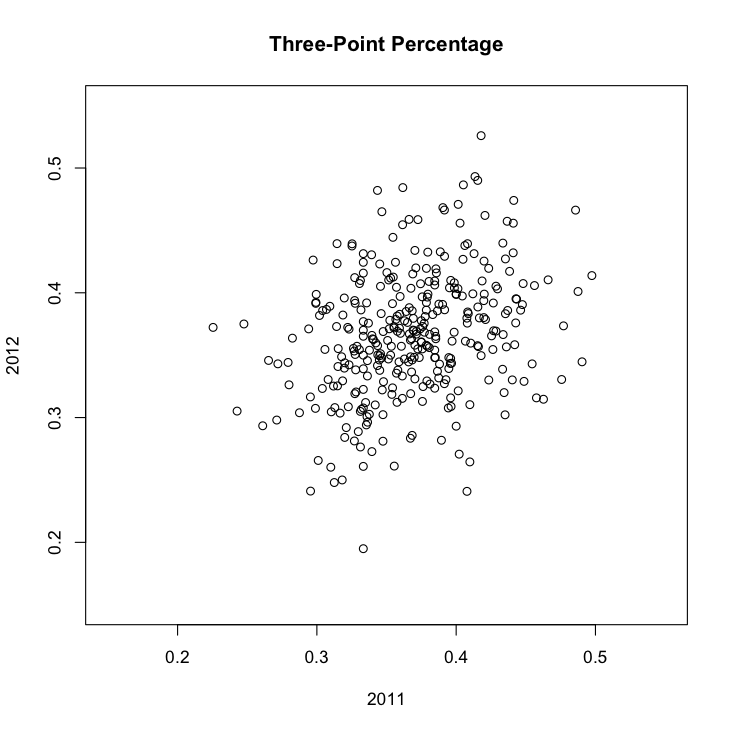
For comparison, here’s the same plot for defensive rebounding percentage (using players who played over half their teams’ minutes in both seasons):
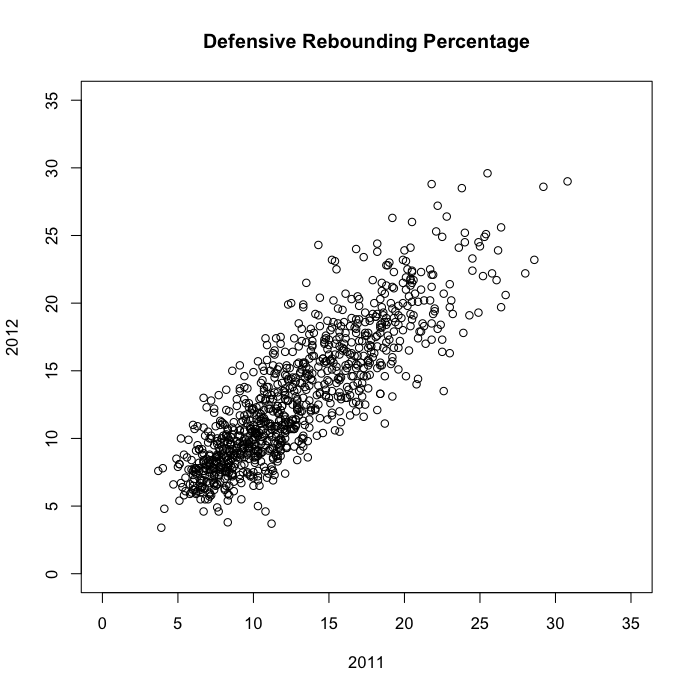
The biggest difference between these two is just the size of the denominators. Every time the other team misses a shot, you get a “defensive rebound attempt,” so you end up with multiple times as many of those as an individual’s shot attempts (on average), with an even larger gap when you cut shot attempts down to three-point attempts. We have a more extensively-tested measure of defensive rebound percentage than we ever do of three-point percentage.
If a player hit on a huge percentage of his three-point attempts last year, he probably won’t be able to repeat that level of performance. If he really struggled, but the coach still trusts his jumper enough to let him fire away again, there’s no reason for fear.
I put out some projections for returning players recently, which uses a more complicated system than this simple regression to the mean consideration, but let’s go through a few of the players who are projected for big changes in three-point performance.
Raised percentage, raised effectiveness.
P.J. Hairston, North Carolina; Nate Wolters, South Dakota State – Hairston started off the year hot, but ended the season at just 27 percent. Wolters made just 24 percent of his three-point attempts. Players rarely shoot so frequently at that level of success, and do so even more rarely when they play for teams who have such high effective field goal percentages. The projections pin Hairston at 38 percent and Wolters at 35 percent for 2013.
Lowered percentage, lowered effectiveness.
Kam Cerroni, Green Bay – Cerroni hit 47 percent of his three-point tries in 2012, and doing so at a fairly low attempt rate for a team with a low eFG means we expect to see him regress to around 38 percent in 2013.
Lowered percentage, raised rate.
Jordan Hulls, Indiana – Hulls shot 49 percent from deep last year, which, as we’ve stated, would be very difficult to sustain for another year. He’s projected for a still-impressive 41 percent three-point shooting season in 2013. While one of the biggest projected drop-offs in the country, that’s less problematic than it sounds because it’s projected to be accompanied by one of the nation’s largest jumps in shot rate. It would be very unusual indeed for someone who shot so well, while attempting just 8.0 three-pointers per 100 team possessions, not to fire away more often the next season.