

Continuing my infinity-part series on three-point defense, I’d like to further pin down just how much control a defense can possibly have on its opponents’ three-point shooting. To take a better stab at this, I looked at every D-I team and determined how many more three-point misses their opponents had over what one would expect based on their opponents’ season-long three-point percentages.
I aggregated the numbers over a five season period from 2008 through 2012. (Why five seasons? It’s long enough to filter out season-to-season noise, but short enough to maintain some continuity in coaches and players on each team.) So, for instance, Syracuse’s opponents attempted 4,164 three-pointers over that time. Based on their opponents’ 3P% from each season, their opponents would have been expected to make 1,444 of those attempts. The Orange’s opponents actually made 1,316, a difference of 128, or 3.06% of their total attempts. Using this method, here are the top ten 3P% defenses over the past five seasons…
Team           Pct    SD
Syracuse      -3.06  -4.3
Arizona       -3.24  -3.9
BYU           -3.13  -3.8
Memphis       -3.18  -3.7
Michigan St   -2.92  -3.7
Louisville    -2.98  -3.7
Kansas        -2.82  -3.6
Florida St    -2.88  -3.6
Georgetown    -3.10  -3.6
Virginia Tech -2.77  -3.4
I’ve ranked the teams by standardizing their percentage differences. One reason to do this is so we can compare 3P% to 2P% defense on the same scale, which I’ll do momentarily. But it’s also marginally more scientific to rank teams by this value. Syracuse’s 3.06% difference occurred on over 1,200 more three point attempts than Georgetown’s 3.10% difference. Thus, it’s more meaningful, 4.3 standard deviations better than their opponents’ average 3P%.
While favorable luck is probably contributing to the statistical effectiveness of these defense, there’s some signal here, too. The impact of each of these defenses is real, and in the context of 3P%, it’s spectacular. If 3P% defense were truly random, we might expect one Division-I team to have an opponents’ 3P% worse than 3 SD’s from average. (If we had 347 people flip a coin a few thousand times, some would rank better at flipping heads than others. This doesn’t imply skill in flipping heads.) In this sample, there were 19 such teams. However, even the best teams are only producing about a 3% influence on opponents 3P%.
By comparison, let’s observe the best 2P% defenses over this five-season span.
Team           Pct    SD
Kansas        -8.34 -14.2
UConn         -7.58 -13.4
Kentucky      -7.37 -12.8
Texas         -6.03 -10.2
Florida St    -6.10  -9.6
Louisville    -5.73  -9.5
Memphis       -5.53  -9.4
Miss St       -5.38  -9.1
Gonzaga       -5.11  -8.1
USC           -5.18  -8.1
The standard deviation values are much larger here, owing to larger departures in percentage and the larger sample size that two-point shots offer. While 19 teams posted a 3P% defense better than 3 SD’s from average, 80 teams posted a 2P% defense better than 3 SD’s from average. If Kansas’ 2P% defense were the result of pure randomness, the chance of a 14 SD anomaly would be the equivalent of the chance of Jeff Withey getting struck by lightning with 5:12 to go in tonight’s game against Oklahoma State. Clearly, the best defenses can have more impact on 2P%.
After showing a bunch of scatterplots with no relationship between data sets, here’s one that does show a relationship. It turns out if you had a good 2P% defense in the last five seasons, you probably had a good 3P% defense.
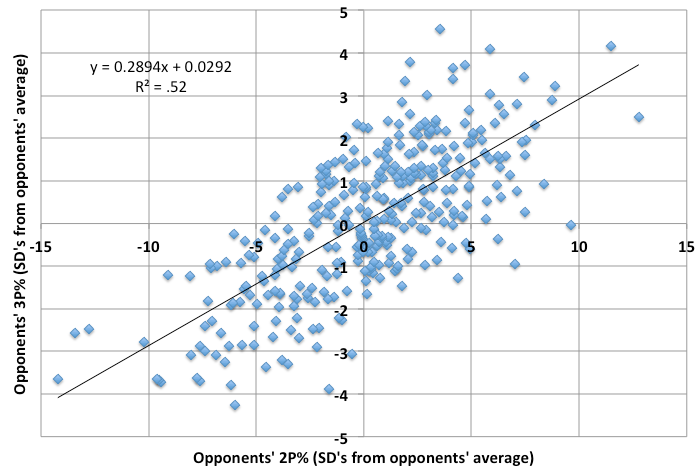
Personally, I think this shows that a team’s decision on the quality of three-point shots they will take is dependent on their ability to score inside the arc. As noted in The Boeheim exception, teams will take more risky three-pointers if they know it’s tough to score inside. At least, that’s my theory. I don’t know if I can prove that. Certainly there could be some effect in the opposite direction, too. If you believe a defense has influence on three-point shooting, opponents might take tougher twos if open threes are difficult to get. But I think it mostly goes the other way.
Since the quality of a team’s 2P% defense explains a fair amount of a team’s 3P% defense, we can actually make a decent prediction of a team’s 3P% defense based on its 2P% defense also. We can also remove the influence of 2P% defense on the 3P% deviations shown above by determining the teams that deviated most from this prediction.
This removes a part of 3P% defense that was the result of the offense changing its standards for when to take a shot. It basically answers the question: How much is each team’s 3P% defense better (or worse) than what we’d expect based on its 2P% defense? Here’s how defensive 3P% looks after that step…
Team           SD
Arizona       -3.4
UTSA          -3.0
Akron         -2.9
NC Central    -2.9
Long Island   -2.6
Syracuse      -2.6
Tennessee     -2.3
Butler        -2.2
The Citadel   -2.1
West Virginia -2.1
To me, this represents something closer to true 3P% defensive ability, like challenging shots and such, since we’ve removed the effects of a team’s 2P% defense that (at least in my theory) are influencing the 3-point shot selection of the opponent.
And it’s closer to the random situation I’ve been expecting to see. It’s still not completely random, but it’s a lot closer. There are 15 teams that rate at least 2 SD’s better than average, and if this was random we’d expect to see seven. The list of teams is a little more jumbled as well. We still have Syracuse and Arizona on the list, but the likes of Akron and Long Island give me more doubt as to how much control these teams had and how of much if this list is influenced by random factors.
These are the teams that have combined unspectacular 2P% defense with very good 3P% defense over the past five seasons. They might be considered the best at pressuring shots, however there’s probably not a ton of variation in ability to do that. I mean, if you stopped trying to challenge shots, you’d see some variation, but assuming everybody is trying, there’s not going to be much difference from the best to the worst.
Anyway, to hopefully conclude this series, here are my opinions in bullet points.
– The offense is largely in control of the quality of 3-point shots it takes.
– These decisions are affected by the quality of the opposing 2P% defense
– 3P% is also influenced by effective challenging of shots.
– All of that can add up to about a 3% swing from average.
– So 3P% defense is not totally random
– But a defense has considerably more direct impact on 2P% than 3P%.