

If it’s the middle of summer and you’re obsessing about trends in offensive rebounding, then you’re either me or some sort of lunatic. I was initially concerned about a very specific aspect of offensive rebounding for an upcoming feature, but along the way I decided to look at the different things related to offensive rebounding that one can mine from play-by-play data, and that led me to what you are about to see.
This isn’t going to be the most glamorous piece of analysis, but if there was a good time for an offensive rebounding data dump, this is it. Now for some facts regarding those second chances…
1. The offensive rebound is dying.
Every single season since 2007, the chances of a missed shot being rebounded by the offense has decreased as stopping transition is prioritized at the expense of getting second chances. If you listen to enough coaches, it doesn’t take long to understand that this is the prevailing thinking, though it may be a bit misguided. You still have Jamie Dixon, Rick Barnes, Tom Moore, and Pat Skerry out there holding the line on attacking the glass, but their ranks decrease with each passing season.
D-I offensive rebounding percentage
Season    OR%
 2006    34.0
 2007    33.5
 2008    32.872
 2009    32.871
 2010    32.7
 2011    32.3
 2012    32.1
 2013    31.8
 2014    31.4
This piece isn’t intended to bemoan the demise of offensive rebounds. I’d like to see more of it because it makes the game more interesting, but I’d also like to see 80-possession games more regularly and that’s not going to happen anytime soon. I’ll watch regardless.
2. The offensive rebound of a missed free throw is really dying.
It turns out that while offensive rebounding percentage is falling for every shot type listed in the play-by-play, last season saw a sharp decline in offensive rebounds of missed free throws.
        Free throws      2-point jumpers       3-pointers          Layups, etc.
Year   OR-DR     OR%       OR-DR     OR%       OR-DR     OR%       OR-DR     OR%
2010 6290-33953  15.6   43645-86143  33.6   39336-86424  31.3   32861-45147  42.1
2011 5975-33525  15.1   42430-86215  33.0   38717-87024  30.8   32409-44492  42.1
2012 5638-32677  14.7   41063-84242  32.8   38506-87146  30.6   33265-46480  41.7
2013 5672-31982  15.1   40937-85904  32.3   39042-88940  30.5   33030-48148  40.7
2014 5692-36743  13.4   37421-78514  32.3   38370-89880  29.9   37169-53870  40.8
SUM 29267-168880 14.8  205496-421018 32.8  193971-439414 30.6  168734-238137 41.5
Since there are three offensive players in the same spot for every free throw, one might think of all the shots listed that free throws could be immune to the dominant philosophy of defending transition. While the drop in second chances that occur on free-throw misses isn’t going to be a premium source of clickbait, it does have ramifications for a certain strategy I’ll detail in the future.
It’s not surprising that shots recorded by the scorer’s table as layups, dunks, or tips are more likely to be rebounded by the offense than two-point jumpers which themselves are more likely to be rebounded by the offense than three-pointers.
There may be a large gradient across the domain of two-point jumpers, though. Based on the layup and three-point numbers, it figures that a seven-foot jumper has a higher offensive rebounding percentage than a 15-foot jumper. Based on Kirk Goldsberry’s work using the NBA’s SportVu data, it’s possible that the latter is rebounded by the offense less often than a typical three-pointer.
3. Offensive rebounds are more likely on blocked shots than shots that get to the rim.
While I’m in the mood for monospaced fonts, let’s continue to break down the offensive rebounding data further for reference purposes if nothing else.
It may not be surprising that shots that make it to the rim are less likely to be rebounded by the defense. Blocked shots that remain in play are basically loose balls and I don’t know of anyone that practices rebounding blocked shots. Here’s a breakdown of the numbers after separating shots that are blocked from shots that aren’t.
                    NON-BLOCKED SHOTS ONLY
      2-point jumpers       3-pointers          Layups
Year    OR-DR     OR%      OR-DR     OR%      OR-DR     OR%
2010 37065-77659  32.3  38712-85511  31.2  23981-34383  41.1
2011 36161-77830  31.7  38036-86083  30.6  23610-33718  41.2
2012 35142-76351  31.5  37868-86197  30.5  24050-35128  40.6
2013 35041-77767  31.1  38322-87933  30.4  23746-36339  39.5
2014 31730-70843  30.9  37717-88936  29.8  26610-40490  39.7
SUM 175139-380450 31.5 190655-434660 30.5 121997-180058 40.4

                  BLOCKED SHOTS ONLY
      2-point jumpers    3-pointers       Layups
Year    OR-DR    OR%    OR-DR   OR%     OR-DR     OR%
2010  6580-8484  43.7  624-913  40.6  8880-10764 45.2
2011  6269-8385  42.8  681-941  42.0  8799-10774 45.0
2012  5921-7891  42.9  638-949  40.2  9215-11352 44.8
2013  5896-8137  42.0  720-1007 41.7  9284-11809 44.0
2014  5691-7671  42.6  653-944  40.9 10559-13380 44.1
SUM  23933-31877 42.9 2730-3908 41.1 38086-47448 44.5
Many of these offensive rebounds are the result of shots being blocked out of bounds, which don’t fall into the loose ball category. We can get a handle on the OR% for blocked shots kept in play by excluding rebounds labeled as team rebounds, since the vast majority of these happen when the ball goes out of bounds. This is where things get interesting.
4. Shots blocked in play are about as likely to be rebounded by the defense as shots that make it to the rim.
Perhaps this isn’t too surprising, either, but blocked shots seem like loose balls, and since rebounding technique probably goes out the window in these cases, one might figure the offense has some advantage over the typical shot. But there’s only a very small lean to the offense on blocks of two-point jumpers and three-pointers compared to their non-blocked counterparts. And blocked layups that stay in play are significantly more likely to be rebounded by the defense than layups that get to the rim.
              BLOCKED SHOTS (IN PLAY) ONLY
      2-point jumpers     3-pointers           Layups
Year    OR-DR     OR%      OR-DR     OR%      OR-DR     OR%
2010  3891-7837   33.2    381-851    30.9   4827-9936   32.7
2011  3765-7849   32.4    440-873    33.5   5011-10054  33.3
2012  3548-7408   32.4    401-888    31.1   5155-10593  32.7
2013  3516-7603   31.6    444-926    32.4   5060-11037  31.4
2014  3365-7213   31.8    391-883    30.7   5848-12459  31.9
SUM  18085-37910  32.3   2057-4421   31.8  25901-54079  32.4

                   NON-BLOCKED SHOTS ONLY
      2-point jumpers     3-pointers           Layups
SUM 175139-380450 31.5 190655-434660 30.5 121997-180058 40.4
If you consider the traditional ball-you-man mentality, defenders would be in better position to recover a blocked shot. This is especially true in the case of layups where blocks result in rebounds that are significantly farther away from the rim than a non-block.
The best point to take away is that if shot blockers keep their swats in play, their teammates have about the same chance of securing the ball than if the ball got to the rim. Or in the case of layups – where most blocks occur – a much better chance. Keeping blocks in play is surely a skill to some extent and it’s an important one for a rim protector.
5. Offensive rebounding is partly about effort.
You’ll occasionally hear a commentator claim that rebounding is about effort. I would propose that rebounding is mostly about size and athleticism, but no doubt there’s a component to rebounding that involves effort and anticipation. And more effort is made the deeper into the game we get. If you’ve made it this far, you deserve a chart.
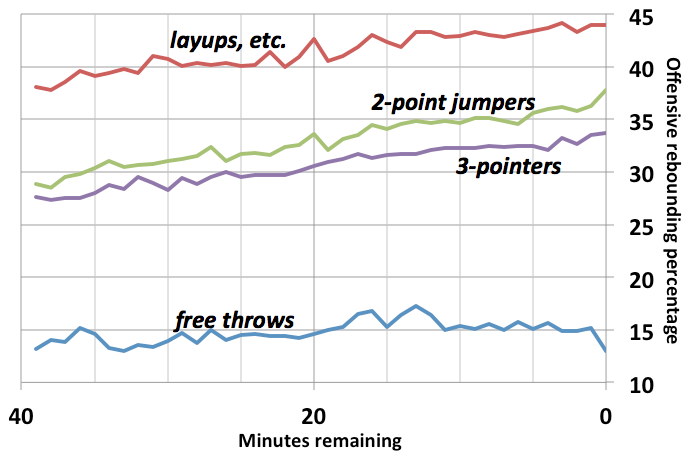
Basically, offensive rebounding percentage increases as a function of time elapsed. One might assume that early in the game, players are cautious about picking up an early foul and take fewer chances trying to grab an offensive rebound. Later in the game, these concerns diminish and more effort is made trying to rebound a miss.
Note that in the final minute, OR% on free throws drops dramatically. This figures to be the result of the leading team taking most of these shots and having little motivation to risk a foul on trying to grab an offensive board. For the other shots in the final minute, the losing team is responsible for the majority of the attempts and it’s more likely to sell out for second chances in an attempt catch up. Thus the final minute has the highest offensive rebounding percentage for non-layups.
So that’s a bunch of stuff on offensive rebounds. Maybe a few things you wanted to know and some you didn’t.