

SCOUTING REPORT
Adjusted efficiency: Raw offensive efficiency is points scored per 100 offensive possessions. The adjusted version adjusts for the quality of opposing defenses, the site of each game, and when each game was played (recent games get more weight). Defensive efficiency is points allowed per 100 defensive possessions, adjusted for the same things. (The ratings glossary page has more details on points per possession calculations.)
Tempo: We can estimate possessions very well from box score stats by using this formula: FGA-OR+TO+0.475xFTA.
For each team, possessions are counted for the team and their opponents, and then averaged. A team’s average tempo is total possessions divided by minutes. This value is then adjusted for schedule, considering the preferred pace of each opponent and when each game was played.
Four Factors
Effective field goal percentage (eFG%): Computed from (FGM + 0.5*3PM)/FGA. This differs from conventional field goal percentage by taking into account the extra value of a made 3-pointer.
Turnover percentage: Turnovers divided by possessions
Offensive rebounding percentage: Computed from OR/(OR + DR). The value in the defensive column can be thought of as offensive rebounding percentage allowed.
Free throw rate: This is now FTA/FGA for both the offensive and defensive values.
Miscellaneous Components
In addition to the various shooting percentages there is…
Block%: Blocked shots / Opp. 2PA
Steal%: Steals / Defensive possessions
Strength of Schedule
In the components section, the value under offense represents the average adjusted efficiency of opposing offenses. Likewise for defense.
Personnel
Bench Minutes: Computed by assuming that the starters’ minutes are accounted for by the five players with most minutes played. Bench minutes are then assumed to be the minutes played by the remaining players, among those that play at least 10% of their teams minutes. This figure is divided by the starters’ minutes plus bench minutes.
Effective Height: Explained by following this link.
Experience: Uses eligibility class weighted by minutes played. A freshman has no years experience, a sophomore has one year experience, etc.
Average Height: Minutes-weighted height in inches.
Height by position: Departure from the D-I average. Position is determined solely by the listed height for each player and their playing time. The shortest 20% of the team’s minutes played are assumed to be played the point guard, the next shortest 20% is shooting guard, etc.
Points by position: Calculated using the same principles to determine position as described above.
SCHEDULE SECTION
This graphic describes the how the schedule page can be interpreted. (The good win/bad loss shading has been discontinued.)
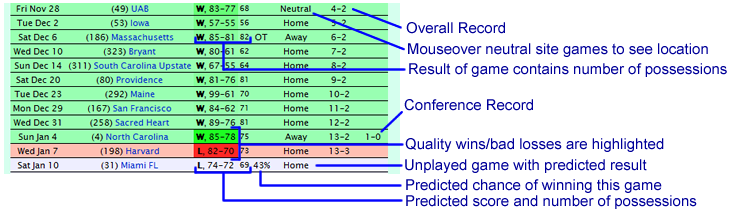
Predictions are based on the current values of the adjusted efficiencies and tempo, with home court advantage factored in.
PLAYER SECTION
Players are now categorized by their involvement in the offense (%Poss) and within each section are ordered by minutes played. These categories have nothing to do with a player’s effectiveness. That is for you to decide using the listed stats.
Players in bold are the top five players by minutes played. Only players that have played at least 40% of their team’s minutes (60% for eFG%, TS%, and FTRate) are eligible to be ranked. Here’s a guide to the stats listed in the players section…
Percentage of possible minutes played (%Min): Self explanatory, I think. Better than MPG in that it accounts for overtime periods. Worse than MPG in that it’s impossible to distinguish lack of PT due to injury from lack of PT due to better teammates. Thus, the G column indicates games played for a player to help on this issue.
Offensive rating (ORtg): A measure of personal offensive efficiency developed by Dean Oliver. The formula is very complicated, but accurate. For a detailed explanation, buy Basketball on Paper.
Percentage of possessions used (%Poss): A measure of personal possessions used while the player is on the court. Simply assigns credit or blame to a player when his actions end a possession, either by making a shot, missing a shot that isn’t rebounded by the offense, or committing a turnover.
Percentage of shots taken (%Shots): This is the percentage of a team’s shots taken, while the player is on the court. This is a pretty good proxy for %Poss, and significantly easier to calculate. It is PlayerFGA / (%Min * TeamFGA).
Effective field goal percentage (eFG%): Same as regular field goal percentage, except that made three-pointers are appropriately given 50% more credit.
True shooting percentage (TS%): (New) This is Gasaway’s old PPWS divided by 2. It’s like eFG%, but throws in trips to the line and converts it to a shooting percentage that approximates what 2-point percentage a player would need to have to score the points he produces on all of his shooting attempts.
Offensive rebounding percentage (OR%): This is the percentage of possible offensive rebounds a player gets and computed as PlayerOR / [%Min * (Team OR + Opp. DR)]. The denominator is scaled based on the percentage of a team’s minutes played by the player.
Defensive rebounding percentage (DR%): This is the percentage of possible defensive rebounds a player gets and computed as PlayerDR / [%Min * (Team DR + Opp. OR)]. It is generally believed that offensive rebounds are more attributable to individual effort than defensive rebounds. Due to its relative rarity, an offensive rebound is considered more valuable than a defensive rebound.
Assist Rate (ARate): This is assists divided by the field goals made by the player’s teammates while he is on the court.
Turnover Rate (TORate): This is the percentage of personal possessions used on turnovers. It can be highly dependent on context. Players that do little passing or dribbling (i.e. spot-up shooters) will have an artificially deflated TO%.
Block Percentage (%Blocks): This is the percentage of opponents’ two-point shots that are blocked by the player while he is on the court. It is computed by Blocks/(%Min * Opponents’ two-point attempts).
Steal Percentage (%Stls): This is the percentage of possessions that a player records a steal while he is on the court. It is computed by Steals/(%Min * Team Possessions).
Fouls committed per 40 minutes played (FC/40): (New) Self explanatory.
Fouls drawn per 40 minutes played (FD/40): (New) Fouls drawn per 40 minutes played. This is a kenpom.com exclusive. Estimated using the following assumptions: 1) Each shooting foul results in an average of 1.8 free throws. 2) 16.3% of all fouls are committed by the offense. (The first two assumptions are derived from D-I averages.) 3) No offensive fouls results in shots (this is not entirely true since some offensive fouls occur in rebounding situations). 4) Players on defense draw fouls at equal rates. 5) Players on offense draw non-shooting fouls proportional to their percentage of possessions used. Apply all of these assumptions using a team’s total fouls drawn, and you end up with what I think is a decent estimate of individual fouls drawn.
FTRate: Free throw rate is calculated by 100*FTA/FGA. This measures a player’s ability to get the line relative to how often he attempts to score.