

Most people understand that scoring margin matters, at least when it comes to evaluating the strength of a team. So the conclusion from the data contained herein is not going to be a huge surprise to most readers. But the data itself is still interesting and I think it’s one of the simpler approaches to demonstrate this idea. First, let me set the table.
I wanted to determine the degree to which scoring margin matters and if there was some point at which it didn’t matter anymore. I went about it like I did for the one-point study. There are obviously more sophisticated ways to do this, and I’m not suggesting this is worthy of being published in an academic journal, but the simplicity of this approach requires no leap of mathematical faith by folks who might otherwise be turned off by a more complex effort.
I looked at all cases in the last ten years where there were rematches in a single season to see how well scoring margin in a home game predicted the outcome of the next road game (or games) in a series. I’ll present the results in three charts. The first one plots the scoring margin in the initial home game against the average scoring margin in the road rematch for those cases.
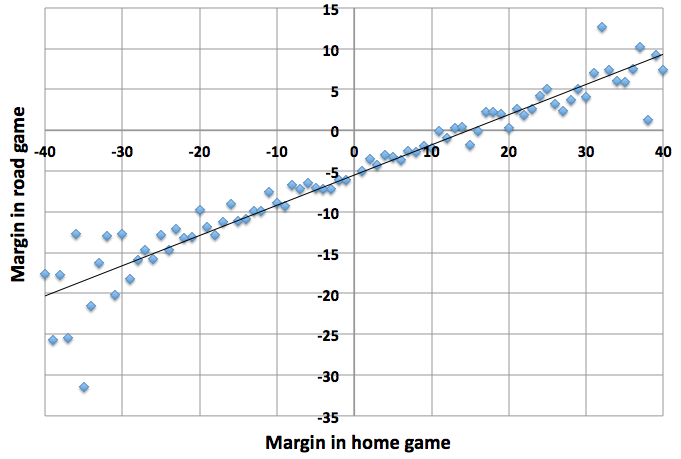
For example, in the 44 cases where the home team won the first road game by exactly 30 points, they won the road rematch by an average of four points. The initial motivation here was to see if really big margins mattered more than other margins. It’s clear from this experiment that a 30-point margin does, in fact, indicate there’s a bigger gap between the competing teams than a 20-point margin. Likewise for a 40-point margin compared to a 30-point margin. The relationship between the margin in the first game and the margin in the subsequent game is remarkably linear. And, whether one likes it or not, there is predictive information in whether a team won the first game by 20 or 30 or 40.
There are several other interesting pieces of information. For instance, it takes a 15-point home win to get a team to the point where you’d expect them to win the road. Is home-court advantage that strong? No, it’s not. Keep in mind this method is going to use conference games almost exclusively and in most situations conference foes are somewhat equally matched. Cases of a team winning (or losing) by 20 or more points are often cases where the winning (or losing) team has overachieved (or underachieved). They weren’t truly 20 points than their opponent to begin with, and this is manifested in the fact that the return game results, on average, in a small win.
(This notion applies to Florida pretty well right now. Yes, I think they are very good, deserving of strong consideration as the best team in the country if you are into ranking such things that way. But unless they are one of the greatest teams in history, they have also overachieved their true ability by a fair amount to this point.)
Hopefully, you can see why the issue of capping margin of victory in a predictive ratings system is not so straightforward. On average, there is information in large margins of victory and additional information in even larger margins of victory.
Let’s do the same exercise, but compare home margin of victory to that team’s chance of winning the road rematch.
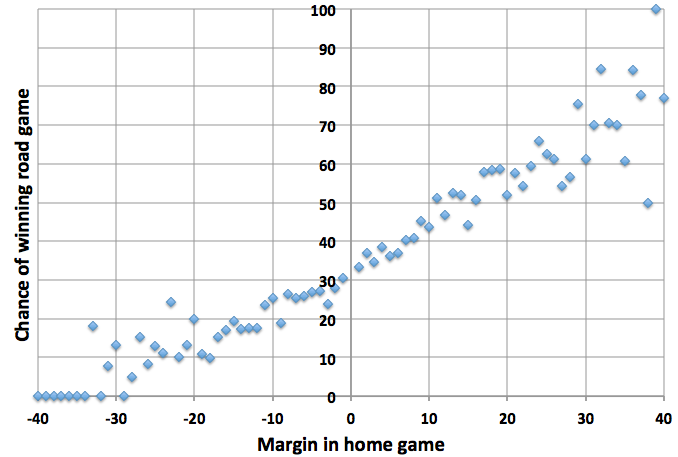
The conclusion is the same as the scoring-margin plot. The bigger you win (or lose) the first game, the more likely you are to win (or lose) the rematch. The data gets noisy beyond 30 points, so here it is in table form for larger ranges.
 1st game    Road     Road
  margin      W-L     Win%
-41 to -50    0-3      0.0
-40 to -31    3-58     4.9
-30 to -21   39-265   12.8
-20 to -11  250-1162  17.7
-10 to -1   814-2326  25.9
  1 to 10  1518-2415  38.6
 11 to 20  1311-1224  51.7
 21 to 30   473-311   60.3
 31 to 40   151-54    73.7
    41+      32-5     86.5
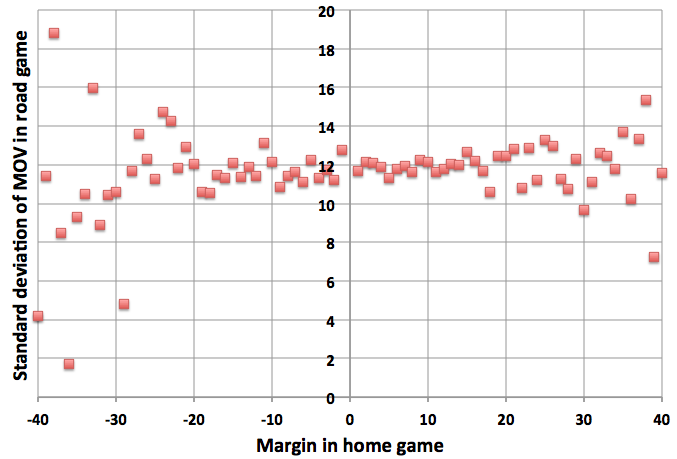
If you’ll allow me to deviate from my promise of simplicity, I wanted to check how reliably margin of victory predicted the rematch margin of victory. It’s reasonable to think that close games give you better information that lopsided games.
 1st game     Avg road
  margin      MOV   SD      n
-41 to -50   -21.0  9.6     3
-40 to -31   -19.6 12.9    61
-30 to -21   -13.8 12.9   304
-20 to -11   -10.1 11.8  1412
-10 to -1     -7.2 11.7  3140
  1 to 10     -3.2 11.9  3933
 11 to 20      0.2 12.0  2535
 21 to 30      3.3 12.0   784
 31 to 40      7.6 12.4   205
    41+       11.0 11.9    37
The standard deviation in the MOV of the road game is fairly constant regardless of the MOV of the first game. There is a bit more variance in the predictive value of extremely large margins, but it’s not a huge difference. A 15-point win predicts the MOV of the rematch nearly as accurately as a one-point win. That’s not to say there’s a ton of information there in either case. Margin of victory clearly matters, but it’s also a mistake to put a lot of stock in the meaning of one game. There’s a lot of noise in the final score.
The takeaway here is that if you are interested in evaluating a team’s ability, simply looking at their record puts you at a disadvantage. Scoring margin matters. This is not to say than an 80-point win over Grambling is more predictive than a 60-point win, but in games involving relatively equal competition, scoring margin is useful – even big margins. At least, it usually matters.
There are exceptions, but identifying them is a challenge and I’m guessing there are many fewer exceptions than people want to believe. The fan of every team that is underrated by a scoring-margin method will claim that this is because their coach is more compassionate than his competitors and empties the bench much earlier in the game than his ruthless colleagues. In reality, though, there isn’t much difference in coaching attitudes.
Maybe the nice coaches empty the bench with two minutes to go and the meanies play their rotation guys to the end. That still leaves a majority of the game where relatively normal conditions exist. No doubt teams are trying harder in a close game than in a 20-point game, but even in the latter the participants are still trying. And I think that’s why scoring margin matters even at margins where the game contains significant stretches of garbage time.
To the extent that there are exceptions, I‘m inherently skeptical to their existence in the absence of a basketball-related reason to explain them. For instance, I feel like I can come up with a plausible theory as to why 2006 Gonzaga or 2009 Oklahoma might have been significantly underrated by a scoring margin system. Both had a very efficient offensive player that could draw a foul seemingly by snapping his fingers. In the final possessions of a close game, points were easier to come by than for most teams. Perhaps these teams, either consciously or subconsciously, felt less inclined to play good defense because they knew it was easier for them to win close games on the offensive end.
There may be other reasons to explain why a team would be mis-rated by predictive systems that incorporate scoring margin, but the theory that a particular coach is a really nice guy and can’t stand the thought of running up the score on his opponent seems rather weak in light of the evidence presented here. For most teams, scoring margin is a useful tool in evaluating their strength, and a random team that appears to be mis-rated relative to its win-loss record or the media’s perception is probably not an exception.