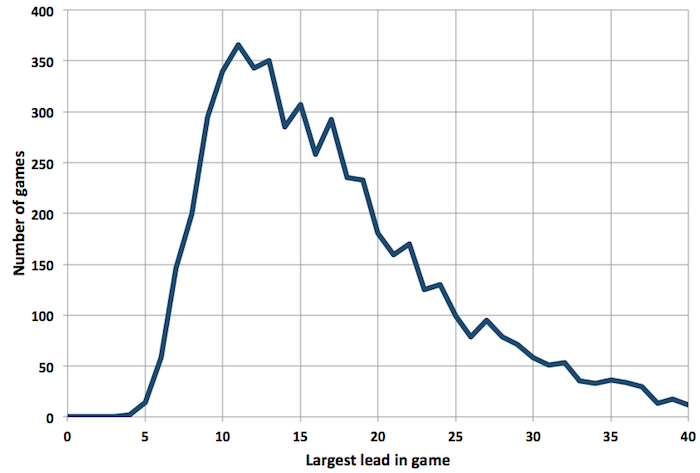
This is not the kind of thing that will make you smarter about college hoops. It might make you dumber because your knowledge of this will take the place of something more useful. But as I work on larger projects, it’s often necessary to wander off course and make something visual of the data I’m working with, even if it means doing so through some sort of trivial task. And that gives you some insight into why you are looking at the plot below, which describes the distribution of the largest lead in last season’s games.

The most common largest lead by either team in a game last season was 11 points, which was observed in 366 games. The smallest largest lead was four points, occurring twice last season.
If you’re like me – and who isn’t – you want to know about those two cases. The first was Butler’s 63-62 win at Wright State on January 6 in a game that had 20 lead changes. And for those that think lane violations are only called near the end of NCAA tournament games, this contest had one as well.
The second took place a day later when North Dakota State beat Southern Utah 72-69. This game is a little more impressive for its overall tightness as it occurred over 45 minutes of action. However, it featured a mere 14 lead changes, due partly to a bizarre ten-minute stretch in the second half where the Bison continuously owned the lead but somehow maintained a margin between one and four points the entire time.
Because the low end of the distribution is bounded by four and the high end is controlled by the ruthlessness of Bo Ryan, we get a skewed distribution where the average largest lead (17.4) is greater than the median largest lead (15), which is greater than the most common largest lead (11). Numbers are fun.

