

[This is a post by Jordan Sperber, who runs the fabulous Hoop Vision blog. He’s also on twitter and you can follow him @hoopvision68. Over the summer, we (mostly he) charted a bunch of 3-point shots to learn more about rebounding. It was painful and time-consuming, but we learned a lot.]
Over the past several months, Ken Pomeroy and I have gone through 50 NCAA games from last season charting missed three-point attempts. Obviously, the farther a shot attempt is from the hoop the longer the potential rebound. We charted missed threes in order to learn more about where the rebounds go and if location affects which teams winds up with the ball. Our 50-game sample yielded 1,164 rebounds to analyze. Coincidentally, after we began doing our own charting Kirk Goldsberry published some great information on the same subject matter. Our findings are fairly consistent with Goldsberry’s and add some more information to the rebounding conversation.
Of all the basketball clichés out there, the idea that a rebound is likely to land on the opposite side it was shot from may be the least controversial. This is for good reason, as basic physics seem to back up the theory nicely. Regardless, rebounding might just be the offensive factor least understood. All we really know is that height helps you rebound and that there appears to be some rebounding instinct which some players possess.
We set out charting missed three-point shots to not only see where rebounds go, but also to see the ensuing effects on offensive rebounding percentage. In order to do this, we classified all three pointers into three different categories: baseline shots, elbow extended shots, and upper wing shots. In order to increase sample size we used the symmetry of the court to consider, for example, left baseline shots and right baseline shots the same. The results of where rebounds traveled were as follows:
                            Rebound Location
Shot Location       Same Side    Center   Opp. Side
   Baseline            33%         19%       48%
Elbow Extended         38%         17%       44%
 Upper Wing            32%         30%       38%
As you can see, the weak side was the most common rebounding locations for all three shot locations (agreeing with conventional wisdom). The interesting takeaway here, although fairly intuitive, is that rebounds seem to go to the opposite side more frequently as the shot location gets closer to the baseline. This is presumably because by definition the “opposite side” is increasing in area as you go from the top of the key to the baseline.
Not only can we use shot location to see where rebounds go, but we can also look at the effects of shot location on offensive rebound percentage. The following table shows our findings, which are consistent with Goldsberry’s:
Shot Location     OR%
   Baseline       33%
Elbow Extended    34%
 Upper Wing       25%
 Top of Key       27%
Our data shows a big contrast between baseline and straight-on shots on OR%. This finding has significant ramifications for diagramming a last-shot situation. All things equal, when drawing up a last possession shot for the tie or win, a corner three would be a wiser shot because you increase your odds of rebounding a miss.
Next, we used our shot charting data to look at not only how shot location affects offensive rebounding percentage, but also rebound location. This is attempting to answer the question “does rebound location affect the offense’s likelihood of retaining possession?” The following diagrams show offensive rebounding percentage when the ball goes to the same side, weak side, and center. Symmetry was again used, so what is labeled as left baseline is really a pooling of both the left and right.
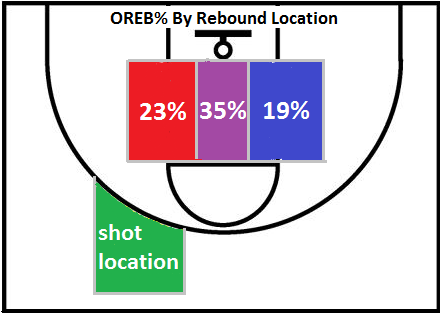
Offensive rebounding percentage is highest when the ball lands in the center of the court. All three diagrams, and in turn all three shot locations, illustrate this fact.
The first diagram shows that upper wing shots produce fewer offensive rebounds at all three rebounding locations. There’s certainly not a glaringly obvious reason for why this is, but I suspect that floor spacing may have something to do with it. Basic help defense principles are to sink towards the ball as it moves farther from your man. Therefore, the closer the ball is to the baseline, the farther away help defenders should be from their individual assignment. This is at least a possible explanation for increased offensive rebounds in the corners (more difficult for the defense to box out).
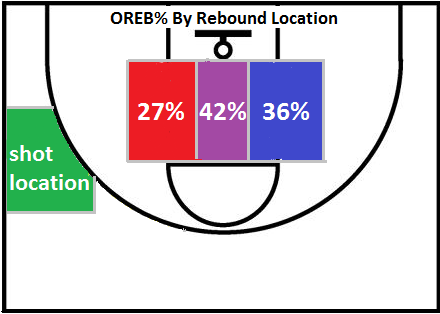
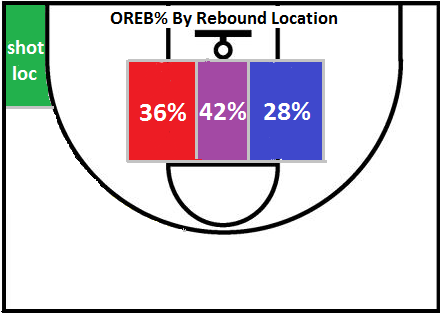
Diagrams two and three have basically reversed same side and opposite side offensive rebounding percentages, but this difference may be due to sample size. However, both locations had equal offensive rebounding percentages of 42% on center rebounds.
There is much to gain from a better understanding of rebounds. When considering a particular shot’s expected value, you must account for the probability of rebounding the potential miss. For example, two identical baseline three-pointers equally uncontested may not have the same expected point value. If one is taken in transition with three offensive players behind half court, then that shot will in the long run lead to fewer points than the same shot with three offensive players in the paint. This study and further studies can help teams further understand good and bad shot selection and even help teams decide how to allocate players in rebounding versus transition defense.