

One of the issues that came up with the previous analysis of early season trends in this space was just how much the lack of charging calls is affecting the historically low turnover rate we’ve seen so far. This is not something that can be answered definitively using publicly available data. We can isolate fouls committed by the offense using play-by-play data, but determining whether that foul was committed by a ball-handler, a shooter, or a screener is pure guesswork.
An easier way to get in the neighborhood is to simply split turnovers into their steal and non-steal counterparts. Recall that turnovers in general are significantly down from previous seasons. While the new rules interpretations have produced a number of changes statistically, the trends in almost all stats have evolved as they usually do. But the trend in turnovers is zigging when previous seasons zagged, increasing since the beginning of the season which is the opposite of what normally happens.
First, let’s look at the evolution of steal percentage (percentage of possessions on which a steal occurs) this season compared with previous seasons. I’m using the same method as the previous analysis in that the average is for each day of the season.
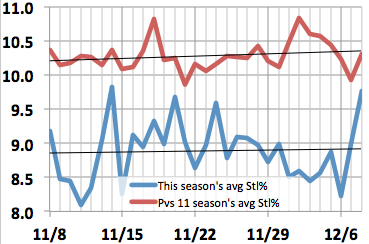
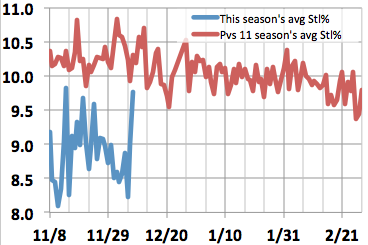
Steal percentage is roughly constant early in the season before dropping ever so slightly during conference play. This season’s start has been fairly flat as well but notice that, not surprisingly, steals are down from previous seasons. When normalized for pace, there have been about 14 percent fewer steals this season compared to the same time over the past 11 seasons.
One might presume this is the result of more cautious defenses, whether it’s because there has been more zone (although some zones cause a lot of turnovers) or just on-ball defenders being less handsy. Also, keep in mind that steals have become more rare in recent seasons anyway, and a fraction of the decrease is probably the result of strategic inertia.
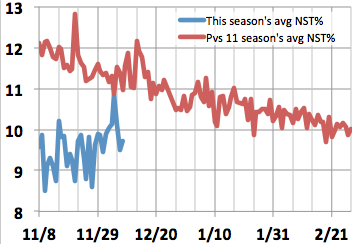
Now let’s check out the trend in non-steal turnovers (NST’s).
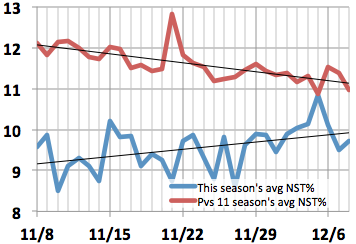
The historical season-long trend is very clear. Offenses show steady improvement in this area as the season progresses. While offenses eliminate about one in 20 steals between the beginning and end of the season, they get rid of one in six NST’s by the end of the season. Not all non-steal turnovers are unforced—and there’s evidence that the defense has a surprising amount of skill in creating these types of miscues—but these turnovers are less in the control of the defense than steals.
This group also include charges and NST’s are down about 18 percent from past seasons. What we don’t know is how much of that decrease can be attributed to fewer charges being called. At the beginning of the season, the difference between the old turnover percentage (12) and what was observed this season (9) could be explained by two fewer charges per team. But it doesn’t seem realistic to assume that the entire difference is tied up in charges. After all, whatever is causing defenses to record fewer steals would figure to also contribute to the drop in NST’s.
So the reduction in charges is almost surely less than the reduction in NST’s, although how much is purely a guess. The interesting thing is that the difference in NST’s between this season and previous seasons is rapidly disappearing. The entire difference over the past few days could explain just under one charge per team per game. It also could be that teams are traveling more or making other unforced mistakes more often, but given that the trend in steals isn’t changing, that seems a little more difficult to believe. This is far from a conclusive study, but the charge may be sneaking its way back into the game.