

There’s a new stat on the team scouting report for you: Continuity. Although it’s more of a storytelling stat, it seems like something that should be tracked by someone. The issue is deciding how to measure it.
One way would be in terms of roster continuity, which determines if the players that played last season are also playing this season. This is what goes into the preseason ratings. But once the season starts, that number only tells part of the story about a team’s continuity.
A player that played one minute last season that becomes a starter this season is providing something new to the team. And a player that was a starter that suffers a season-ending injury in the first game also has an impact not captured by roster continuity. So the version of continuity used here is something I would call ‘minutes continuity’. It’s determining what percentage of a team’s minutes are played by the same player from last season to this season. Conveniently, the national average happens to be around 50%.
Here’s a simple example in graphical form which may assist your understanding…

Just take each player on the current roster, use the minimum minutes (on a percentage basis) he played comparing this season and last season, and then take the sum for all players.
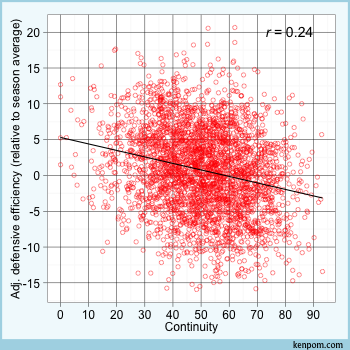
Not surprisingly, teams with more continuity tend to perform better, with the effect being stronger on offense. The following plots show data for all teams since 2008.

The 2010 Butler team had the most continuity of minutes since 2008: 93.2% of the Bulldogs’ minutes were played by the same players between the 2009 and 2010 seasons. Three teams have had zero continuity between seasons, winning a combined 19 games.
However, it’s obviously not true that teams should simply try to maintain a stable roster in order to get better. There are good reasons to make changes to the rotation, if not the roster itself, if one’s goal is solely to win as many games as possible. However, continuity that comes about organically often leads to success, and teams with high continuity are usually successful in their conferences.
One interesting takeaway from these numbers is that, despite the increased likelihood of early-entries from power conference teams, those schools fare reasonably well against the rest of the country with respect to continuity. I’ll close with the average continuity by conference since 2008.
 1 Pat  56.1%
 2 A10  55.9
 3 B10  55.1
 4 BE   54.9
 5 SC   54.7
 6 Ivy  54.4
 7 ACC  54.2
 8 MAAC 53.2
 9 ASun 53.1
10 CAA  52.8
11 B12  52.7
12 NEC  52.4
13 MVC  51.8
14 Amer 51.6
15 Sum  51.3
16 P10  51.3
17 MAC  51.2
18 AE   50.9
19 BSth 50.7
20 WCC  50.4
21 Horz 50.0
22 SEC  49.3
23 MWC  48.9
24 BSky 48.8
25 Slnd 47.9
26 CUSA 47.7
27 BW   47.5
28 OVC  46.7
29 SB   46.1
30 MEAC 45.6
31 WAC  44.2
32 SWAC 41.3
Regardless of what conference a team is in, a lack of continuity is inevitable at some point. Even if every player wants to stay with the team another year and the coach agrees to have them back, seniors have to go. But it takes a special set of circumstances for a team to be at either extreme of the continuity spectrum. Here’s this season’s full list from Valpo to St. John’s.