

I try to avoid dropping names, but allow me to use a one-time Nate Silver exception. It was in 2007 when the old Basketball Prospectus site was launching that I spoke to Nate. One of his first questions was whether I had some sort of projection system for the upcoming season. I had to politely explain to him that was a silly idea. There is so much roster turnover and so many of the new players have no prior statistical track record, that it’s nothing like doing MLB projections.
But it really wasn’t as preposterous as I thought then. A few years later, I cranked out some preseason ratings based on little more than returning minutes, a team’s performance in recent seasons, and some recruiting information, and they didn’t look too bad. Actually, the top four teams in the first edition for the 2011 season managed to end up as one-seeds. That may never happen again as long as I’m doing this, but algorithm-based projections have since gained some measure of credibility with others joining the fray.
As the season winds down, it’s a good time to look back on the rankings issued before the season started to see how well they predicted the future. Instead of just looking at my own, I thought it would be useful to also look at the predictions issued by Dan Hanner of Basketball Prospectus and the folks at TeamRankings, along with the AP poll.
For my first trick, I’ll show you how the top 25 of each system turned out. The truth in this case will be each team’s seed in the NCAA tournament. True, the computer ratings are not trying to predict tournament seeds, but it’s the closest thing to a neutral site on which to judge each system. Theoretically, the committee is ranking the best teams, in their opinion, with their seeding. Or something like that.
In the following table, the seed for each system’s preseason top 25 team is given, with some shading to make things a bit more clear.
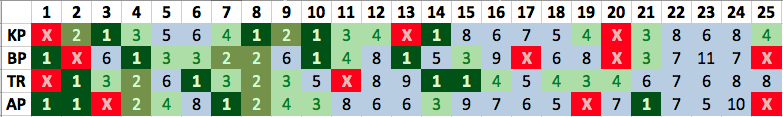
It’s difficult to score the various systems in an objective way. If we just look at the top ten I think we have to give the nod to the AP. Their top two (Indiana and Louisville) ended up being one-seeds and were arguably the two best teams in the land. Their whiff on Kentucky was slightly less embarrassing than the computers, and eight of their top ten ended up being top-four seeds. Sure, the AP was too high on N.C. State, but the computers were too high on UCLA.
I’ve been on record stating my admiration for the preseason AP poll and it still should be treated with a lot of respect. Unfortunately, it’s the only time voters try to put together a ranking based on which teams are the best. During the season, they minimize their expertise by going to an accomplishment-based system, which anyone could do, whether they’re connected to the game or not.
However, this season the AP lost some accuracy by mangling the rest of the top 25 a bit. In the 11-25 range, they only got two of the eight remaining top four-seeds. Taking the top 25 as a whole, the AP captured ten of the the 16 top-four seeds, while Hanner (BP) identified 11, and TeamRankings (TR) and I got 13. Still, it’s more reasonable to give some extra weight to the rankings closer to the top, and this would favor the AP and to some extent, BP.
The other thing we need to check is how the algorithm-based systems did on the D-I universe as a whole. For this I’m using the projected conference record that each ranking system spit out for each of the 345 teams participating in conference play. In this analysis, TeamRankings wins (barely!) with a total error 737 wins or 2.14 per team. I finished with an error of 739 wins and Hanner finished 753 wins off. Not surprisingly, a consensus forecast was the best approach – using an average of each system’s prediction would have given an error of 713 wins. (By the way, Phil Birnbaum’s recent piece on predictions is timely in this case and casts some skepticism on reading too much into a system’s accuracy based on one season’s worth of results.)
In doing this, I was forced to look back on the commentary from the release of my own ratings. Texas was a big bust and Cleveland State didn’t work out well at all (although Anton Grady was lost for the season after six games). But the comments in there on Utah and Towson being unrealistically underrated were prescient, and in fact Towson was the team the ratings missed the most. The Tigers were predicted for an average of two CAA wins by the computers and finished with 13. On the flip side, Lamar was predicted for nine Southland wins and finished with one. Special recognition goes to North Texas as well. Each system forecast 15 Sun Belt wins for the Mean Green and they finished with seven.
Using the average forecast of the three systems, the predictions for 147 teams (43%) ended up within one win of their actual conference total. I don’t like to rain on the parity parade, but I think it says something about the lack of parity that nearly half of all teams can have their future predicted so well. Just two power conference teams – Virginia Tech and Oregon State – were as many as five games off from the average prediction.
A nice feature of the computers was that agreement among the systems tended to make for a more accurate forecast. There were 174 teams for which each system’s prediction differed by no more than one win. In those cases, the average error of the consensus forecast was 1.9 wins, while in the other cases, the average error was 2.2 wins. In the 32 cases where the systems each predicted the same number of wins, the error dropped to 1.7 wins.
Finally, my wish is that more people enter the preseason prediction game next season. The writers contributing to the AP poll do a great job, but their poll stops with 25 teams, and it’s a little too contaminated with groupthink for my taste. As shown again this season, more automated methods can be competitive with the human polls, and in addition serve the rest of the D-I universe. The more algorithms we have, the better those predictions will be.