

I’ve been concerned about the sample size of this week’s work regarding 3P%. We’re only looking at 8-10 games in each half of the conference season. As Kevin Pelton gently reminded me, there are fewer three-point shots than two-point shots and thus there will be more noise in the 3P%. Still, if there is so much noise over 8-10 games that you can’t see a signal, just think about how much noise there is over six games. Consider that when your bracket goes up in flames.
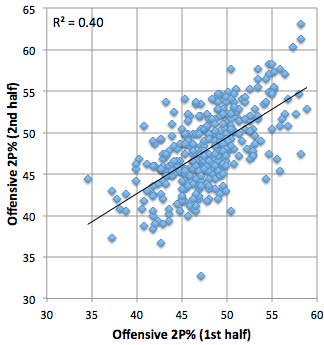
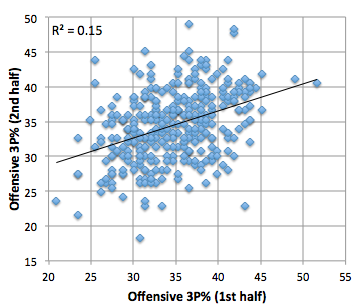
Still, the offensive 3P% scatterplot shown yesterday was troubling. If the defense has no influence on 3P%, why does offensive 3P% show no relationship between the first and second half of conference play? The only solution is to simulate the conference season and see what the three-point percentage scatterplot would look like if team 3P% were truly independent from shot to shot.
But first, I got some suggestions to plot 3PA% against 3P%, and those plots are worth sharing. These are the offensive and defensive plots for the 2011 conference season.
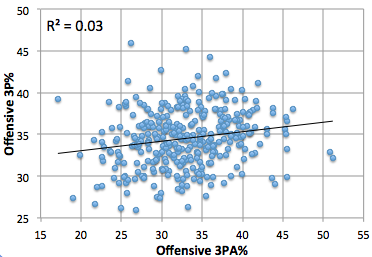
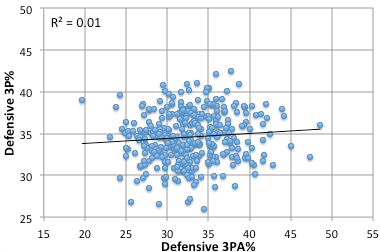
Defensive 3PA% has little relationship with defensive 3P%, which supports the idea that 3P% is defense independent. However, there’s not a great relationship between offensive 3PA% and 3P%, either.
I decided to see if a simulation would reproduce the shooting plots for 2P% and 3P% shown yesterday. I assumed every team played an 18 game conference schedule and used the conference averages of 37 2PA’s and 17 3PA’s per game. I also assumed that a team’s final shooting percentage in conference play (either 2P% or 3P%) represented their chance of success on each field goal attempt. Here’s what the simulator spit out.
These plots make some sense, which is to say they make more infinitely sense than what happens in reality. OK, sure, the 2P% is going to be influenced by defense. Maybe the 3P% plot is as well. Defenses don’t guard a team, they guard players and are bound to focus on limiting the looks of better shooters more than poorer shooters. Perhaps there’s some impact of this, but in trying to tweak the simulation to account for this, I couldn’t produce anything resembling the randomness observed in reality. I think the bigger impact might be game context, though. Consider this data, which shows 3P% between the 8 and 10 minute mark of the second half in games played over the past two seasons, based on the lead/deficit of the shooting team.
Margin  3P%
 -15   27.8
 -14   23.6
 -13   30.5
 -12   28.7
 -11   28.2
 -10   29.1
  -9   28.9
  -8   26.9
  -7   29.4
  -6   33.4
  -5   30.7
  -4   31.0
  -3   28.6
  -2   29.5
  -1   34.6
   0   28.7
   1   32.5
   2   32.1
   3   30.1
   4   36.2
   5   35.2
   6   36.4
   7   34.1
   8   35.8
   9   36.5
  10   38.6
  11   43.7
  12   36.8
  13   44.6
  14   46.8
I’m only looking at games after January 1 to remove most of the obvious mismatches. It stands to reason that a trailing team will lower its standard for what qualifies as a good 3-point shot and that is revealed in these numbers. During conference (or NCAA tournament) play, when a team is going to find itself on either side of the scoring ledger with varying frequency, this kind of thing can mask a team’s true shooting ability.
Log5 season is around the corner and I need to resume writing about stuff that regular people care about. I think the takeaway from this week is that 3P% is largely out of direct control of the defense, and it’s a lot less predictable than one might think when two teams of reasonably equal ability face each other. When another team makes a surprising run in the NCAA or even its conference tournament people are going to wonder why we didn’t see it coming. However, there are some things that you can’t see coming and 3-point shooting is one of the best examples of that.