

In Part 1, I went over some of the relevant win probabilities to consider for the strategy of fouling when the game is tied and the shot clock is off. If one assumes that any missed free throw is rebounded by the defense, then the strategy of fouling would be recommended in the majority of situations. Assuming perfection is a bad way to evaluate strategies, though. This is why some analyses of fouling up 3 tends to show a large advantage for fouling when history suggests that advantage is small (or none at all). Or that attempting to get the 2-for-1 at the end of a half is beneficial, but not as much as one might think.
Factoring in the possibility of an offensive rebound to this analysis makes it somewhat more complicated, but it’s necessary to determine the merits of fouling. My examples will all use the single bonus situation. Not surprisingly, the math is much more favorable for fouling when the offense is in the single bonus since the possibility of making zero free throws increases.
Allowing for an offensive rebound, I’ll list the possible situations that could result from a foul in a tie game, and the associated win chances based on history. (Assuming the possession after a foul begins with between 20 and 25 seconds left.) Unlike the data I presented in Part 1, I have removed all possessions that began with a steal since we want to know the chances of winning from a situation where the defense is set.
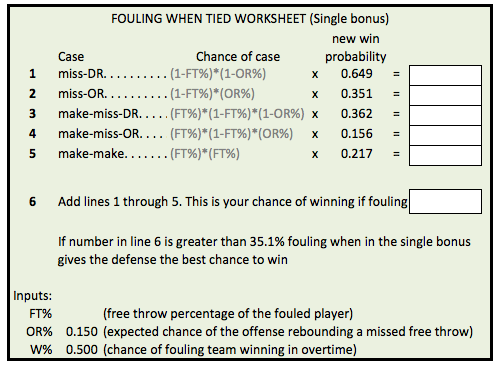
Free throws by      Situation for
fouled team         fouling team           W   L  OT  W%
----------------------------------------------------------
miss-DR            Tied   on offense     202  34 327 64.9
miss-OR            Tied   on defense      34 202 327 35.1
make-miss-DR       Down 1 on offense     113 217  48 36.2
make-miss-OR       Down 1 on defense      29 300  65 15.6
make-make          Down 2 on offense      38 281 110 21.7
Armed with these numbers, we can figure out the breakeven point for implementing the fouling strategy. Unfortunately, this isn’t defined by a single number, but two: the chances of giving up an offensive rebound and the ability of the free throw shooter. Actually, the relative strength of the two teams is also an important consideration, but I’ll stick to the case of equality for now in order to keep the discussion as simple as possible.
Let’s assume that the offense has a 15 percent chance of rebounding a missed free throw. This is reasonable since that’s the national average over the past five seasons. I’m comfortable with using that as an average, but there are reasons why this number may be generous. First, last season’s rate was closer to 13 percent. Second, given that nobody fouls with the game tied, teams may be more foul-averse in these situations and consequently may crash the glass with less urgency than usual.
Using the above probabilities, sending a 71.4 percent free throw shooter to the line will produce a win probability for the fouling team of 35.1 percent, identical to the historical chances of not fouling in this situation. (For a two-shot situation, the cut off is 57.3 percent, which makes you wonder why the strategy is apparently used more frequently overseas, where the single bonus situation does not exist.)
For people who like doing those handy worksheets during tax time, here’s one for determining the viability of this strategy:
Obviously, the worse the free throw shooter, the more the odds tilt in the favor of the fouling team. And since primary ball-handlers tend to be very good from the line, it’s not always possible to foul a sub-70 percent shooter early in the possession. However, as long as this strategy is a novelty, which will probably be for many, many years, it might not be that difficult.
Consider the case during the West Coast Conference tournament when San Francisco was tied with BYU. Coming out of a timeout with 33 seconds left, Matt Carlino (71 percent FT shooter) dribbled out most of the clock while the Cougars set up a play for a last-second shot. Carlino was a realistic fouling option once you consider that BYU was in the single bonus and its offense against USF’s defense was a battle of strength vs. weakness that Rex Walters’ should have wanted to avoid.
But USF might have done even better. What if USF had tried to trap Carlino out of the timeout? I doubt it’s something that would have been expected. And with any luck, the ball would have ended up in the hands of the Cougars’ other primary ball-handler, Kyle Collinsworth, a 57 percent shooter for his career. To the worksheet!
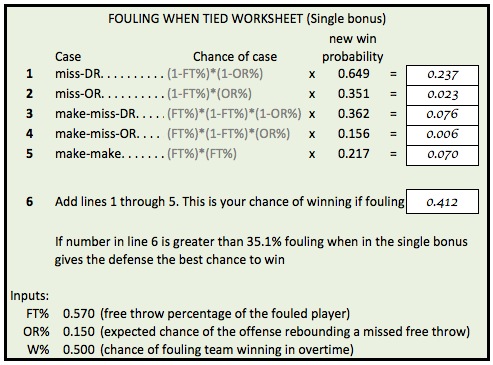
Sending Collinsworth to the line would have given USF a 41.2% chance of winning assuming the average win probabilities shown above, compared to a 35.1% chance by not fouling. But that assumes that the Dons would have had a 50% chance of winning in overtime, which probably wasn’t true.
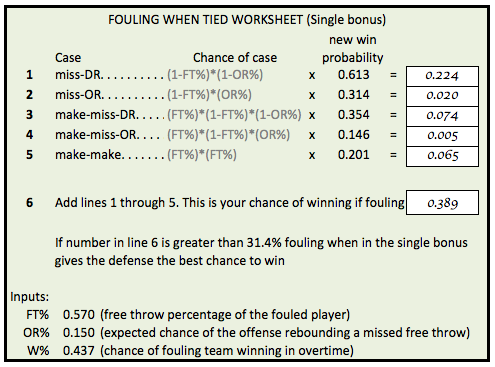
My method had given them a 38% chance of winning the game at tip-off, which would translate to a 43.7% chance of winning in overtime. Here’s one more look at the worksheet using that assumption. The win probabilities decrease for each case and so the chance of winning playing traditional defense drops to 31.4%. Thus, there’s more of an advantage to fouling.
The issue of team strength is an important consideration. In playing straight up defense, most games will go to overtime. Historically, 58% of such games have gone to an extra period. Therefore a team’s chances of winning while defending are very sensitive to its strength relative to the opponent, while the chances of winning while fouling are relatively insensitive to team strength because overtime becomes more rare in these cases.
To give you an idea of this effect, here are the free throw percentage limits given a particular win probability for the fouling team. Fouling a shooter worse than these percentages improves the fouling team’s chance of winning using my assumptions.
Win probability     FT% threshold
Pre-game    OT     1-and-1  2-shot
  .900    .756       58.2    39.9
  .800    .671       62.2    44.7
  .700    .607       65.4    48.8
  .600    .552       68.4    52.9
  .500    .500       71.4    57.3
  .400    .448       74.4    62.0
  .300    .393       77.9    67.6
  .200    .329       82.4    74.8
  .100    .244       88.2    84.2
For a team considered a heavy favorite, there aren’t many cases where the strategy can be implemented. But for underdogs, fouling when tied is definitely something to consider. In the final installment, I’ll talk about two of the most famous cases that occurred last season, summarize the proper use of this strategy, and discuss other pesky nuances that should be considered when thinking about this approach.