

This is part of a series of posts examining whether offense or defense has more control of various aspects of a typical college basketball game. The introduction is here. A description of the methodology is here.
Today’s stat is three-point attempts, but it really could be “shot distribution”. As a team’s three-point attempt is also its non-two-point attempt. The offense checks it at 71% for control of its shot attempts. Yes, the defense has more control over the number of 3’s taken than the number that go in, but the difference is closer than I was expecting.
But it definitely makes sense that the offense is in majority control, especially when you consider things on a player level. No team was going to make Jahlil Okafor take three-point shots and you weren’t going to make Naz Long stop taking 3’s. In the long run, you can move the needle on a team level with some persistence. A tight zone will make SMU shoot more 3’s, but no defense exists that can turn a Larry Brown team into a Joe Scott team.
However, it’s clear that some coaches deploy a defense that, intentionally or not, encourages the opposing offense to one extreme or the other in terms of its shot attempts. Here are the top ten coaches in 3-point attempt defense, among those with 10 seasons in the books since 2002:
 1 Mike Krzyzewski 24.8%
 2 Randy Bennett   25.7%
 3 Joe Scott       28.0%
 4 Horace Broadnax 28.2%
 5 James Green     28.3%
 6 Oliver Purnell  28.3%
 7 Scott Sutton    28.3%
 8 Bo Ryan         28.5%
 9 Lorenzo Romar   28.9%
10 Trent Johnson   28.9%
And the ones allowing the most:
 1 Murry Bartow    40.3%
 2 Don Maestri     40.1%
 3 Steve Pikiell   39.4%
 4 Ron Mitchell    38.6%
 5 Ed DeChellis    38.4%
 6 Dave Calloway   38.2%
 7 Jim Boeheim     38.0%
 8 Karl Hobbs      37.8%
 9 Tommy Dempsey   37.6%
10 Tim O’Shea      37.5%
Krzyzewski’s teams have ranked in the nation’s top 10 in 3PA% defense in 10 of the past 14 seasons, with Duke’s worst ranking over that time being 24th. Coach K’s teams have also been excellent at affecting three-point accuracy. He ranks second to John Calipari in 3P% defense, holding opponents to 31.4% since 2002. However, his teams have ranked in the top 10 nationally in that category in just three of the past 14 seasons, including two finishes outside the top 100 and another four outside the top 50. Even the best three-point accuracy defenses face a tremendous challenge to impact opposing shooters’ ability to make shots.
In this series, one aspect that has been overlooked is how much luck is involved in each stat. Strictly speaking we are looking at how much the offense controls out of the portion that can be controlled. The overall amount that can be controlled is a lot larger in three-point attempt percentage than it is in three-point accuracy. One way to illustrate this is to view a plot of the predicted value versus the actual value for each stat, using my simple model. Each data point here is a game from last season, so there are about 5,500 cases in all.
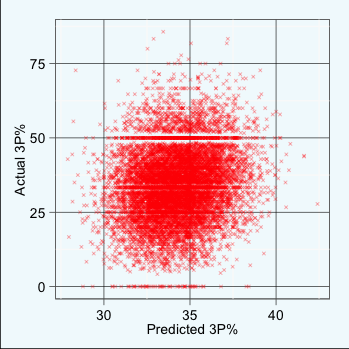
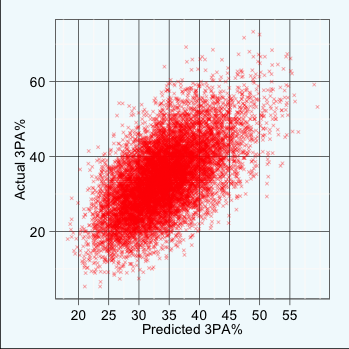
The correlation coefficient (r) for predicted 3PA% is 0.61, which is the highest of any of the stats I’ll be looking at. In other words, just using season-long data for each team, 3PA% is the most predictable thing in a basketball game. The number of three-pointers each team will take is about as predictable as the pace each team will play at. Pace and shot distribution are part of a game’s DNA. Conversely, the r for three-point accuracy is 0.15, which is the lowest of anything I’ll be looking at.
Most of that difference is caused by the disparity in opportunities for each event during the game. There were an average of 54 field goal attempts per team per game last season with just 19 of those being three-point attempts. So there are many more opportunities in each game for a team’s true 3PA% to be revealed. However, that’s not the whole story, because the r value of 3PA% beats out things like turnover percentage which has the advantage of an even bigger sample (possessions).
The point is that even though there isn’t a huge defense in the percent of defensive control over three-point percentage and shot distribution, the difference is much larger than it would appear, because so little of shot distibution is left to chance.
Here’s the annual data for shot distribution. There hasn’t been a home court effect to speak of.
Year  %Offense  HCA
2015     68     0.0%
2014     70     0.1
2013     71     0.0
2012     70     0.1
2011     68     0.1
2010     71     0.1
2009     75     0.1
2008     73     0.0
2007     73     0.0
2006     74    -0.1
AVG      71     0.0%
And here’s a summary of the findings to date. I’ve added the r value for each stat to give a sense of the stat’s predictability.
Offensive Spectrum – Ordered by pct of offensive “control”
FT%  98%  (HCA=0.5%, r=.24)
APL  86%  (HCA=-0.1s, r=.60)
3P%  83%  (HCA=0.7%, r=.15)
OR%  73%  (HCA=1.1%, r=.22)
3PA% 71%  (HCA=0.0%, r=.61)
???  71%
???  64%
???  59%
???  50%
???  49%
???  36%
???  30%
???  15%