

This is part of a series of posts examining whether offense or defense has more control of various aspects of a typical college basketball game. The introduction is here. A description of the methodology is here.
There are still statistics that have yet to be regularly cultivated from a basic stat sheet. Partitioning turnovers into their steal and non-steal constituents is another example of a missed opportunity in the world of counting stats. Steals are tracked, but non-steals remain neglected in the analytical world.
I feel like non-steal turnovers deserve a better name, like ordinary turnovers or generic turnovers. But non-steal leaves no doubt as to what these are – all of those turnovers where is a steal isn’t credited. This includes violations like traveling and offensive fouls, but also ballhandling errors that can’t be chalked up to an opposing defender, with bad passes being the most likely I would suspect.
The temptation is to call these “unforced” turnovers, and while the offense has majority control over the number of non-steal turnovers, it’s influence is only at 59% so the defense plays a significant role in their existence. But non-steals are definitely less forced by the defense than steals which is good news from the scorekeeping department.
There’s signifcant overlap between the two categories, though. The line between what is a steal and what isn’t can get blurry sometimes. Beyond that, the skills required to force steals are also going to be effective in causing other turnovers.
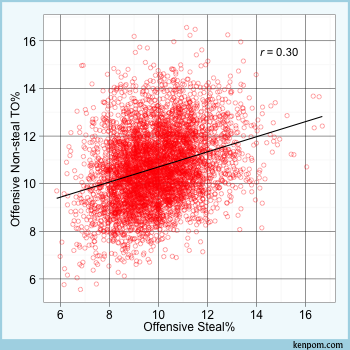
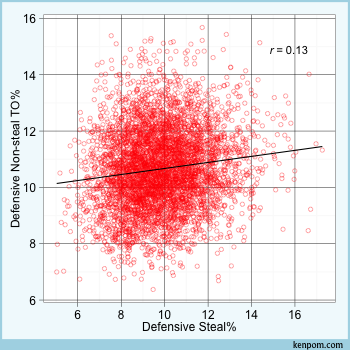
One thing I’ll point out graphically is the relationship between steals and non-steals on both sides of the ball. If your defense is forcing a bunch of steals, it will tend to be above average at forcing some of those ballhandling errors, too. However, this is more true offensively as the following plots illustrate, based on all team-seasons since 2002.
Among coaches, Mike Brey is far and away the king of not benefitting from non-steals on the defensive end. Notre Dame doesn’t force turnovers in general, but they’ve had some decent seasons in the steals department. Last season the Irish were 82nd in defensive steal percentage, but just 274th in defensive turnover percentage, thanks to ranking next-to-last in non-steals forced.
An incompetent offense is always going to donate some non-steals no matter how passive the defense is, and non-steals rank pretty high on the things influenced by random variance from game to game. But Mike Brey’s defenses fight through all of that and maintain extremely low non-steal rates year after year. Here’s where Notre Dame has ranked in steals and non-steals forced since 2002.
Season Steals Non-Steals
 2015    82      350 (2nd to last)
 2014   173      321
 2013   305      326
 2012   261      304
 2011   325      320
 2010   255      346 (2nd to last)
 2009   322      343 (2nd to last)
 2008   243      338 (4th to last)
 2007    36      326
 2006   276      334 (last)
 2005   150      324
 2004   258      313
 2003    97      327 (last)
 2002   104      317
In a stat where the offense has majority control and there’s significant random variance, somehow Mike Brey’s defenses have ranked last or next-to-last in non-steals forced five times in 14 seasons, with another four seasons in the bottom 11.
Mike Brey’s teams are also among the best at avoiding fouls. And over the past decade, only Phil Martelli consistently employs a shorter rotation than Brey. I’m sure those things are related. I’d guess Notre Dame is as uninterested in taking charges as any team in the land. (A brief exception was the era where Scott Martin apparently went rogue and started racking up charges, almost pushing the Irish into the top 300 in non-steals. “I can’t say annually we’ve embraced [taking charges] as much as I’d like”, Brey says in that piece.)
This allows Notre Dame to have its best players on the floor longer, a contributing factor to its consistently effective offense. Of course, avoiding charges figures to have a negative influence on the defense, and here we have an illustration that considering offense and defense independent entities can be an oversimplification. A coach can ramp up his team’s effectiveness on one end of the floor by making strategic sacrifices at the other end.
On a related note, there is one key statistical difference between steals and non-steals. Defensive steal rate is related to non-steal rate, foul rate, block rate and 2-point defense.
Call:
lm(formula = Stl_d ~ NST_d + FTR_d + BlockPct_d + FG2_d, data = df)

Coefficients:
            Estimate Std. Error t value Pr(>|t|)
(Intercept) 1.715379   0.568480   3.017  0.00256 **
NST_d       0.180687   0.018335   9.855  < 2e-16 ***
FTR_d       0.023427   0.004117   5.690 1.34e-08 ***
BlockPct_d  0.173825   0.011272  15.421  < 2e-16 ***
FG2_d       0.078493   0.009822   7.992 1.66e-15 ***
Non-steal rate is related to those things as well, but the effects of blocks and two-point defense is negative. In human terms, teams that block more shots tend to get more steals but fewer non-steals.
Call:
lm(formula = NST_d ~ Stl_d + FTR_d + BlockPct_d + FG2_d, data = df)

Coefficients:
             Estimate Std. Error t value Pr(>|t|)
(Intercept)  9.773030   0.422776  23.116  < 2e-16 ***
Stl_d        0.110974   0.011261   9.855  < 2e-16 ***
FTR_d        0.060743   0.003115  19.500  < 2e-16 ***
BlockPct_d  -0.133394   0.008843 -15.085  < 2e-16 ***
FG2_d       -0.026847   0.007739  -3.469 0.000527 ***
Teams challenging two-point shots and getting blocks are presumably taking fewer charge or forcing other turnovers that occur prior to a shot. Not coincidentally, the distant runner-up to Mike Brey is non-steal rate was Jim Calhoun, whose teams finished in the top three in block rate in nine of his last 11 seasons.
Here’s the season-by-season breakdown of offensive influence and home-court advantage in non-steal turnover percentage.
Year  %Offense  HCA
2015     63    -0.4%
2014     63    -0.4
2013     50    -0.4
2012     53    -0.4
2011     58    -0.4
2010     65    -0.4
2009     57    -0.4
2008     59    -0.4
2007     64    -0.4
2006     62    -0.4
AVG      59    -0.4
Offensive Spectrum - Ordered by pct of offensive “control”
FT%  98%  (HCA=0.5%,  r(off)=.19, r(def)=.04)
APL  86%  (HCA=-0.1s, r(off)=.55, r(def)=.23)
3P%  83%  (HCA=0.7%,  r(off)=.12, r(def)=.06)
OR%  73%  (HCA=1.1%,  r(off)=.23, r(def)=.08)
3PA% 71%  (HCA=0.0%,  r(off)=.52, r(def)=.33)
A%   71%  (HCA=2.6%,  r(off)=.32, r(def)=.21)
PPP  64%  (HCA=3.7,   r(off)=.51, r(def)=.36)
NST% 59%  (HCA=-0.4%, r(off)=.24, r(def)=.20)
???  50%
???  49%
???  36%
???  30%
???  15%