

Who has the largest home-court advantage in college basketball? How many points is it worth? Well, I have some bad news for you: It is really impossible to answer these questions with much precision. We can look at the box score of a game and see how many points a team won by or how many points each player scored.
Maybe one could do a little more fancy maths and make an estimate on what each player contributed to the point total. But we can’t tell how many points the home court contributed. Maybe someday, but for the most part people don’t care as much about the value of home-court as they do about the value of a star player. So that’s where the research focus lies.
But it’s a fun analytic exercise to try determine the value of home-court. I’ve been thinking about it for a while, starting a few years ago I wrote this article about home-court advantage at ESPN. The analysis was rather primitive and I apologize to everyone for paying their hard-earned Insider money for that. Basically, it identified the teams that had the largest difference between their home and road scoring-margin in conference play. Those teams probably had the largest home-court advantage, right?
For instance, from 2002-2009, Texas Tech outscored its opponents by an average of 6.0 points in conference games in Lubbock and were outscored by 9.3 points per conference game on the road. The difference of 15.3 suggests a home-court advantage of 7.6 points per game relative to a neutral court. That figure was the highest among 320 teams that played at least 50 conference games over that time.
If we could go back to 2009, maybe I could convince you that United Supermarkets Arena, or whatever it was called then1, was one of the most difficult places to play.2 But accepting that the Red Raiders’ home floor was worth close to eight points seems beyond the bounds of a legitimate home-court advantage value.
And that tells you that this method doesn’t really measure home-court advantage. To be precise, the 7.6 points represents how much better a team played in home games than road games. Or even more precisely, that figure is the difference between home and road scoring margin. To a large extent we should expect that number to reflect the difference in a team’s play between home and road venues. We should also expect the difference in a team’s play to reasonably reflect the value of home-court if we’re controlling for quality of competition.
And since we’re only considering conference games, we are controlling for the quality of competition. Over enough games – Texas Tech played 64 games each on the road and at home over those eight seasons – random noise should be minimized. The Red Raiders could have had a strong home-court advantage but also benefitted from a few more breaks at home. Maybe they caught teams on especially bad nights or maybe they had their best games at home. Going forward I’ll put quotes around “home-court advantage” when referring to this measure because it’s really measuring actual home-court advantage plus some amount of noise.
The average team had a “home-court advantage” of 3.75 points per game over this time period. Home much of an advantage would the team with the best home-court have? This is an interesting question. One way to get an idea is to try and make predictions.
If that 7.6 points per game were real, we’d see something close to that going forward. But over the next eight seasons, from 2010-2017, Texas Tech had a “home-court advantage” of just 4.0 points. That is still easily above the national average, but the point is it’s a serious drop from what was observed over the original 64 games. That’s not surprising considering that almost any time a team or player is leading some statistical category it is the product of skill and good fortune, and some level of regression to the mean is right around the corner.
There seems to be a lot of good fortune for teams that led the country in “home-court advantage” from 2002 to 2009. Of the 50 teams that had the best “HCA” in the first period, 48 of them had a worse “HCA” in the second period we’re looking at. In fairness, home-court advantage has been decreasing across the country as a whole in recent years. The average over the second eight-year period was a half-point lower than the first.3 Still, 45 of the 50 had a worse “home-court advantage” relative to the average “HCA” of each period.4
Anyway here’s a plot of “home-court advantage” comparing every team5 between the two periods. There are two things to take away from this visualization. First, the black line represents the 1:1 slope. Dots to the right of that line represent teams that had a lower “home-court advantage” in the most recent eight-year period. As you can see, that’s most teams.
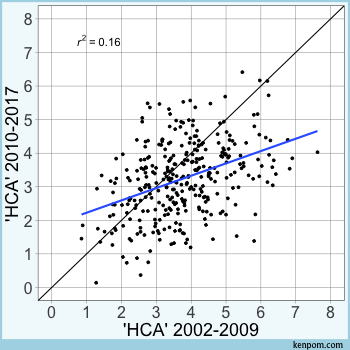
The blue line is the best-fit line for the points. Our pals at Texas Tech own the rightmost point on the this plot. A team with their “home-court advantage” in the period from 2002 to 2009 would have been expected to have an advantage of something like 4.6 going forward based on the regression. And the team with the least advantage from the first period, New Hampshire, would have been expected to have an advantage of 2.2 points in the future. Is that a plausible range for actual home-court advantage across the nation’s 351 teams? One can only guess, but it does seem reasonable.
That there’s a fair amount of scatter suggests either there isn’t much difference in the range of home-court advantage across the land or that one can do better than using past “home-court advantage” to predict future “home-court advantage”. As it turns out, both things are true. To be continued…
| ^1 | The home page for United Supermarkets Arena oddly carries the title of its former name. |
|---|---|
| ^2 | I doubt I could, but work with me here. |
| ^3 | Last season, “home-court advantage” in conference games was a pathetic 2.78 points with home teams winning just 59% of those games. Both figures are almost surely the lowest in the game’s history. Based on recent trends, we’ve got about 60 years until home-court advantage becomes a disadvantage. |
| ^4 | We still have the issue that we’re not exactly measuring home-court advantage. We’re comparing one fuzzy HCA measure to another. And furthermore, it’s possible that true home-court advantage is not constant over long time periods or even from game-to-game. |
| ^5 | This includes the 325 teams that played at least 20 home and road games in each period. |