

Box scores have been added to the site. They are linked to the scores on each team’s page. Let’s get this out of the way first: They are only available for this season and will likely never be available for any previous seasons. If you’re a seasoned user of advanced statistics, then the data doesn’t need much explanation. For the rest of you, here goes…
The score at the top includes each team’s ranking on the day of the game. It also includes the possession count in brackets.
One difference between box scores here and box scores elsewhere is that two-point and three-point stats are separated. If we didn’t have box scores and we were trying to make one today, we wouldn’t have columns for all field goals and three-pointers. The same goes here for defensive and offensive rebounds. There’s no total rebound column here.
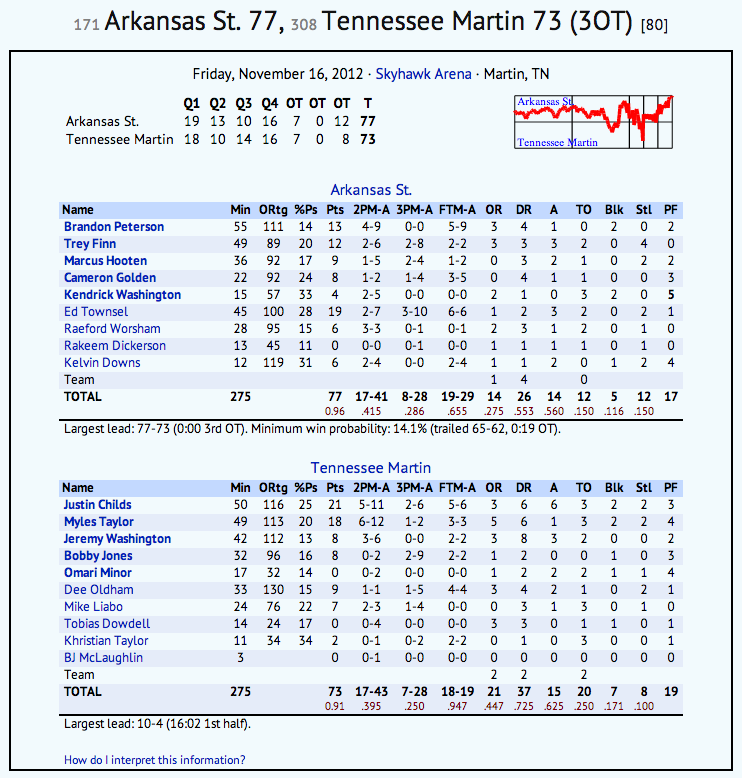
The other addition here is (where play-by-play is available) a line score with score-by-quarter. I don’t know that it’s going to bring great analytical gain, but it’s something different. Hey, if you always wanted to compute CBA-style standings for your conference, your dreams have come true.
Offensive rating (ORtg) and usage rate (%Ps) are computed for each player that played at least ten minutes. In cases of fewer minutes played, the assumptions used to estimate these figures have a greater potential of breaking down and leading to non-sensical numbers.
The red number below each of the team totals is its tempo-free counterpart. Hopefully it’s intuitive what each of those figures means, but for clarity, here is a guide:
Pts: Efficiency (Pts / possessions)
2PM-A: 2-pt field goal percentage
3PM-A: 3-pt field goal percentage
FTM-A: free throw percentage
OR: offensive rebounding percentage (OR / (OR + opponent’s DR))
DR: defensive rebounding percentage (DR / (DR + opponent’s OR))
A: assist percentage (A / FGM)
TO: turnover percentage (TO / possessions)
Blk: block percentage (Blk / opponent’s 2PA)
Stl: steal percentage (Stl / possessions)
Naturally, there’s some win probability info included as well. A mini-graph in the upper right (where play-by-play is available) gives you a flavor of the competitiveness of the game. You can click it to get the larger version that was previously linked directly from scores on the team page. Under the winning team’s portion of the box you can also learn their minimum chance of winning and when that occurred.
You can click on the arena name to see an image of the building courtesy of Google Maps. In a few cases, this takes you to an unexpected location (usually a random field in Missouri) because the arena name is not geo-tagged properly in Google.
I think that covers it for now. I’ll eventually be building out the player pages with this information.
[The image shown is the box for the Arkansas State/Tennessee-Martin game from 11/16 which featured a scoreless overtime period. How did I miss this?]